Basic Analysis (IRR, NPV, MIRR)
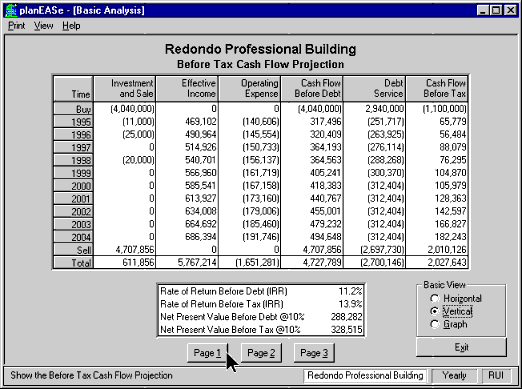
Creates reports that include Before Tax Cash Flow Projection, Taxable Income Projection, and After Tax Cash Flow Projection. Measures shown include Internal Rate of Return (IRR), Net Present Value (NPV) and Modified Rate of Return (MIRR), all before and after tax.
Basic Analysis allows you to view/print the overall cash flow projection for the
investment in any of three Views: Vertical, Horizontal, or Graph. To change between
these views, just click the appropriate Basic View Button (at the bottom right of
the screen). Here you are seeing the Basic Analysis in Vertical View (the Before
Tax Cash Flow Projection, Page 1) for the
Redondo Professional Building,
an investment on your planEASe System Disk saved under the Assumption Set name "OFFICES".
The Basic Analysis Screen contains a Basic View Control at the right bottom of the
screen which allows you to switch between the three Views of your analysis:
Horizontal View organizes the Cash Flow Projection in a one page spreadsheet
format, with the years running horizontally across the top of the page, and each
of the 3 (or 5 for Partnership/LLC analyses) pages presented as a separate horizontal
section of the spreadsheet.
 Vertical View
 organizes the Cash Flow Projection with the years running
vertically down the side of the page and presents the information as separate pages
(
3 pages for the
Real Estate Investment Analysis,
models RUI and RUM, and 5 pages for the
Partnership/LLC Analysis, models
RPI, RPM, RPR, and RPF). You may view any of these pages by pressing the corresponding
Page Button at the bottom of the screen.
 Graph View
 (available if you have purchased the optional
Graphics Extension)
allows you to display/print four different graphs of data contained in your Basic
Analysis. Any Debt Funding or Repayment and/or any Capital Spending planned during
the Holding Period is eliminated from these graphs so that they reflect the results
of ongoing operations rather than such one time events. The Graphs are:

- Allocation of Effective Income is typically displayed as a stacked
graph showing how the total Effective Income in each year is allocated to pay the
Expenses and Debt Service on the property, leaving the remaining cash income. Since
the Effective Income less Expenses is defined as Net Operating Income, the intersection
of the Expense and Debt Service stacks shows NOI as well. Setting the #’s control
for the graph to Cumulative shows numbers for the Effective Income, NOI, and Cash
Flow levels, while setting it to Normal shows the annual Income, Debt Service and
Expense levels.
- Cash on Cash is the year’s Net Income divided by the original Investment
(the amount in the "Cash Flow Before Tax" item at the "Buy"
time).
- Debt Coverage Ratio is the year’s Net Operating Income divided by
the year’s Debt Service.
- Net Capitalization Rate is the year’s Net Operating Income divided
by the Price of Property.
Creates reports that include Before Tax Cash Flow Projection, Taxable Income Projection, and After Tax Cash Flow Projection. Measures shown include Internal Rate of Return (IRR), Net Present Value (NPV) and Modified Rate of Return (MIRR), all before and after tax.


