Sensitivity Analysis ('What if')
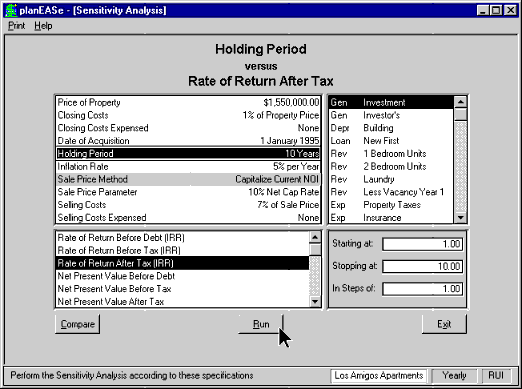
Performs 'What if' for any assumption in your analysis versus any measure, such as Rate of Return (IRR or MIRR), Net Present Value (NPV), Net Capitalization Rate, Cash on Cash, Debt Coverage Ratio, or Loan Amount. Sensitivity Analysis shows how these measures vary with a change in any of the assumptions like Price of Property, Holding Period, Cap Rate at Sale, Renewal Probability, Vacancy, TI's, etc. Sensitivity Analysis reports a one page table and graph showing the relationship between the assumption value and the chosen measure.
Sensitivity Analysis will allow you to vary any assumption against many measures.
In essence this is the "What if" part of the software for IRR, Cash on Cash, Debt
Coverage Ratio (DCR), Loan Amount, MIRR, and Net Present Value (NPV).
In any planEASe projection, there are several assumptions whose values are inherently
uncertain. For instance, you enter the inflation rate that will prevail during the
time you own the real estate. Additionally, you enter the number of years you will
hold the property before selling and the capitalization rate (or other method) determining
the sale price. These values are uncertain. As you perform the analysis, the worth
of the investment is measured by the system in terms of rates of return and net
present values. Additionally, you may choose the Capitalization Rate, Cash on Cash
Before Tax, or Debt Coverage Ratio shown in the Ratio Analysis section of the ProForma
Income Statement for the Sensitivity Measure. The concept of Sensitivity Analysis
is to investigate how these measures vary with a change in one of the assumptions.
Any measure may be chosen for the Sensitivity Analysis, and
any assumption
may be chosen as well.

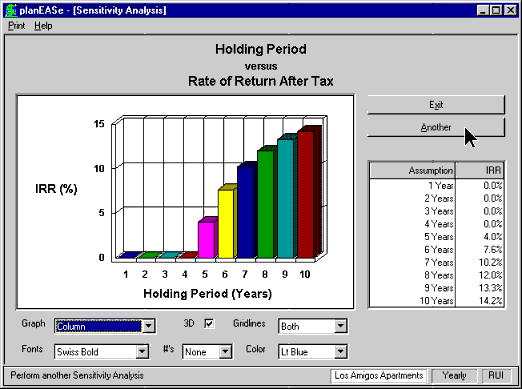
Sensitivity Analysis provides a one page table and graph which describes the relationship
between the assumption value and the resulting measure, as shown in the screen above.
Here the user has asked how the Rate of Return After Tax changes as the Holding
Period is varied. The analysis shows the Rate of Return which would result if the
property were held for one through ten he’ll years. For this property, if the
Holding Period is less than five years, the transaction costs are greater than the
earnings and appreciation.

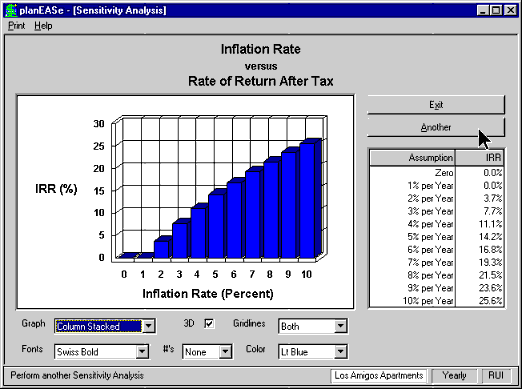
Here is the graph from another Sensitivity Analysis. This time the user has asked
how the Inflation Rate affects the Rate of Return After Tax. The assumptions provide
that the rents, expenses and property value change in line with inflation, so it
is intuitive that the rate of return increases as inflation increases. This is what
is meant by the commonplace that leveraged real estate is an excellent inflation
hedge. It is one thing to simply state that an investment is a good hedge against
inflation, but the Sensitivity Analysis capability in planEASe enables you to
quantitatively
evaluate that hedge and show graphically how the individual investment benefits
from inflation. Here the rate of rate of return increases approximately 3.5% to
4% for each 1% change in the inflation rate, which is typical of highly levered
real estate investments (80% Loan to Value in this case). The graph is flat before
2% inflation because the rate of return is negative in this area and planEASe reports
a zero rate of return value in such cases.

These are but two examples of how you might want to use Sensitivity Analysis. For
instance, how about a graph showing the after tax rate of return versus the vacancy
factor or the sale price? Graphs like this provide one page visual answers to common
questions about financial projections. Going further, suppose you’re syndicating
a property. How about a graph of your fee on sale versus the Limited Partners’
Rate of Return After Tax? Could that help you plan your fee structure better? We
think so.
Performs 'What if' for any assumption in your analysis versus any measure, such as Rate of Return (IRR or MIRR), Net Present Value (NPV), Net Capitalization Rate, Cash on Cash, Debt Coverage Ratio, or Loan Amount. Sensitivity Analysis shows how these measures vary with a change in any of the assumptions like Price of Property, Holding Period, Cap Rate at Sale, Renewal Probability, Vacancy, TI's, etc. Sensitivity Analysis reports a one page table and graph showing the relationship between the assumption value and the chosen measure.


