Acquisition Report
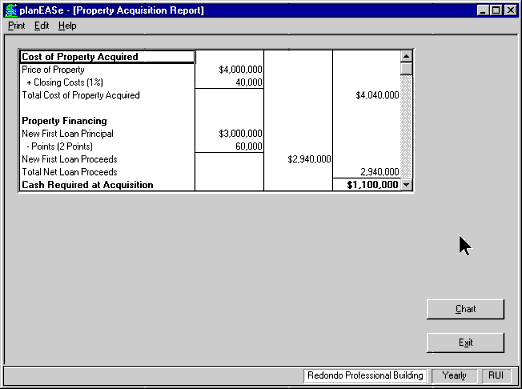
shows the cash required at acquisition, considering price, closing costs, and loan proceeds. Pie Charts are available here by adding the Graphics Extension.

This simple report shows the cash requirement at acquisition considering price,
closing costs, and loan proceeds. Only loans in effect at the Acquisition Date are
shown. For instance, if you have a refinancing planned in your Assumption Set, it
will not affect this report. Similarly, if you have planned an assumption of an
existing loan, the report will compute the loan balance assumed (and subtract any
points). Proceeds are shown for each loan if you have planned multiple loans in
your Assumption Set.
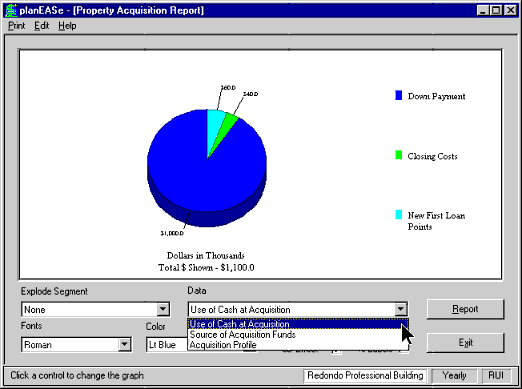
If you have purchased the optional Graphics Extension, a
Chart button will
be available, offering Pie Charts of the information contained in the report. Pie
Charts are available showing
- Source of Acquisition Funds
- Use of Cash at Acquisition
- Acquisition Profile

Below the Pie Charts are the Graph Controls. These controls allow you to customize
the chart's appearance to your specifications. You may want to experiment with each
of the controls to see how they affect the displayed (and printed) chart, as described
below. In addition, you may print, edit and export Pie Charts.
- 3D adds an attractive three dimensional effect to the graph.
- color specifies the first (bottom) color shown.
- Font controls the typeface used to display the graph labels and
numbers.
- Data allows you to choose between various available Pie Charts.
- Explode Segment explodes any segment to emphasize it for presentation.
- $ Labels adds $ values to the segment labels.
- % Labels adds percentage values to the segment labels.
- Label Lines adds lines leading to the segment labels.
shows the cash required at acquisition, considering price, closing costs, and loan proceeds. Pie Charts are available here by adding the Graphics Extension.


