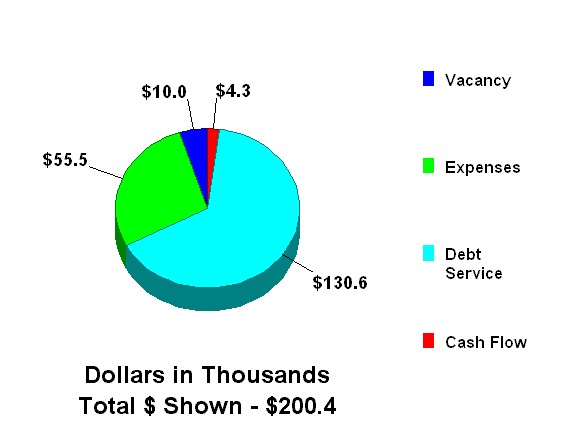
The APOD is a very useful snapshot of the status of a property investment as of the projected Acquisition Date, showing most of the information relevant to the investment, absent any projections of performance.
| Purpose | Broker's Recap |
| Name | Los Amigos Apartments |
| Location | 1000 Mayfair Avenue |
| Property Type | Apartment Complex |
| Date | 17 July 2010 |
| Units | 42 |
| Price | $1,550,000 |
| -Loans | 1,240,000 |
| Down Payment | 310,000 |
| +Acq Costs | 15,500 |
| +Loan Points | 18,600 |
| Investment | 344,100 |
| $/Unit | % of GI | Annual $ | |
| Gross Income | |||
| 1 Bedroom Units (10 units) | $3,936 | 19.6% | $39,360 |
| 2 Bedroom Units (32 units) | 4,920 | 78.6% | 157,440 |
| Laundry | 86 | 1.8% | 3,600 |
| Total Gross Income | $4,771 | 100.0% | $200,400 |
| - Vacancy & Credit Loss | 239 | 5.0% | 10,020 |
| Effective Income | $4,533 | 95.0% | $190,380 |
| Less: Operating Expenses | |||
| Property Taxes | 443 | 9.3% | 18,600 |
| Insurance | 71 | 1.5% | 3,000 |
| Pool | 29 | 0.6% | 1,200 |
| Gardener | 18 | 0.4% | 750 |
| Utilities | 114 | 2.4% | 4,800 |
| Resident Manager | 238 | 5.0% | 10,000 |
| Maintenance | 76 | 1.6% | 3,200 |
| Reserve | 76 | 1.6% | 3,200 |
| Miscellaneous | 29 | 0.6% | 1,200 |
| Management Fee | 227 | 4.8% | 9,519 |
| Total Operating Expenses | $1,321 | 27.7% | $55,469 |
| Net Operating Income | $3,212 | 67.3% | $134,911 |
| Less: Debt Service | 3,109 | 65.2% | 130,583 |
| Net Operating Cash Flow | $103 | 2.2% | $4,328 |
| Capitalization Rate | 8.70% |
| Gross Income Multiplier | 7.73 |
| Cash on Cash | 1.26% |
| Debt Coverage Ratio | 1.033 |
| Price/Unit | $36,905 |

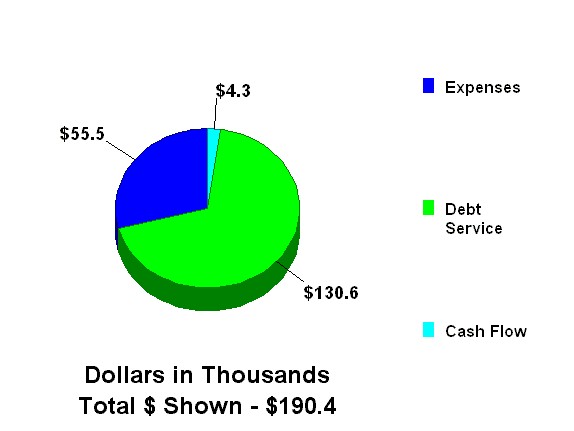
This report shows the projected cash requirement for acquisition of the Los Amigos Apartments on 1 January 2001.
| Cost of Property Acquired | |||
| Price of Property | $1,550,000 | ||
| + Closing Costs (1%) | 15,500 | ||
| Total Cost of Property Acquired | $1,565,500 | ||
| Property Financing | |||
| Bank of America Loan Principal | $1,240,000 | ||
| - Points (1.5 Points) | 18,600 | ||
| Bank of America Loan Proceeds | $1,221,400 | ||
| Total Net Loan Proceeds | 1,221,400 | ||
| Cash Required at Acquisition | $344,100 |
This Statement is for the Los Amigos Apartments as acquired on 1 January 2001 for a Price of $1,550,000, subject to a Loan of $1,240,000, for a Down Payment of $310,000.
These reports can be prepared either before or after tax. They combine the Basic and Detail Analysis report information into a very readable format familiar to real estate professionals and accountants. Further, the reports offer information not shown in the Basic and Detail Analysis Reports, such as Ratio Analysis, projected Sale Proceeds by year, and Return and NPV measures by year, as well as a Common Size Statement and a Dollars/Square Foot or Dollars/Unit Statement.
| 2001 | 2002 | 2003 | 2004 | 2005 | 2006 | 2007 | 2008 | 2009 | 2010 | |
| Gross Income | ||||||||||
| 1 Bedroom Units | $39,360 | $41,328 | $43,394 | $45,564 | $47,842 | $50,234 | $52,746 | $55,383 | $58,153 | $61,060 |
| 2 Bedroom Units | 157,440 | 165,312 | 173,578 | 182,256 | 191,369 | 200,938 | 210,985 | 221,534 | 232,611 | 244,241 |
| Laundry | 3,600 | 3,780 | 3,969 | 4,167 | 4,376 | 4,595 | 4,824 | 5,066 | 5,319 | 5,585 |
| Total Gross Income | $200,400 | $210,420 | $220,941 | $231,988 | $243,587 | $255,767 | $268,555 | $281,983 | $296,082 | $310,886 |
| Less: Vacancy & Credit Loss | 10,020 | 10,521 | 11,047 | 11,599 | 12,179 | 12,788 | 13,428 | 14,099 | 14,804 | 15,544 |
| Effective Income | $190,380 | $199,899 | $209,894 | $220,389 | $231,408 | $242,978 | $255,127 | $267,884 | $281,278 | $295,342 |
| Less: Operating Expenses | ||||||||||
| Property Taxes | 18,600 | 18,972 | 19,351 | 19,738 | 20,133 | 20,536 | 20,947 | 21,366 | 21,793 | 22,229 |
| Insurance | 3,000 | 3,150 | 3,308 | 3,473 | 3,647 | 3,829 | 4,020 | 4,221 | 4,432 | 4,654 |
| Pool | 1,200 | 1,260 | 1,323 | 1,389 | 1,459 | 1,532 | 1,608 | 1,689 | 1,773 | 1,862 |
| Gardener | 750 | 788 | 827 | 868 | 912 | 957 | 1,005 | 1,055 | 1,108 | 1,163 |
| Utilities | 4,800 | 5,136 | 5,496 | 5,880 | 6,292 | 6,732 | 7,204 | 7,708 | 8,247 | 8,825 |
| Resident Manager | 10,000 | 10,500 | 11,025 | 11,576 | 12,155 | 12,763 | 13,401 | 14,071 | 14,775 | 15,513 |
| Maintenance | 3,200 | 3,360 | 3,528 | 3,704 | 3,890 | 4,084 | 4,288 | 4,503 | 4,728 | 4,964 |
| Reserve | 3,200 | 3,360 | 3,528 | 3,704 | 3,890 | 4,084 | 4,288 | 4,503 | 4,728 | 4,964 |
| Miscellaneous | 1,200 | 1,260 | 1,323 | 1,389 | 1,459 | 1,532 | 1,608 | 1,689 | 1,773 | 1,862 |
| Management Fee | 9,519 | 9,995 | 10,495 | 11,019 | 11,570 | 12,149 | 12,756 | 13,394 | 14,064 | 14,767 |
| Total Operating Expenses | $55,469 | $57,780 | $60,203 | $62,743 | $65,405 | $68,197 | $71,126 | $74,198 | $77,421 | $80,803 |
| Net Operating Income | $134,911 | $142,119 | $149,691 | $157,646 | $166,003 | $174,781 | $184,002 | $193,686 | $203,857 | $214,539 |
| Less: Debt Service | 130,583 | 130,583 | 130,583 | 130,583 | 130,583 | 130,583 | 130,583 | 130,583 | 130,583 | 130,583 |
| Net Operating Cash Flow | $4,328 | $11,536 | $19,108 | $27,063 | $35,420 | $44,199 | $53,419 | $63,103 | $73,275 | $83,956 |
| Taxable Income and Taxes | ||||||||||
| (Losses Carried Forward) | ||||||||||
| Taxable Revenues | $190,380 | $199,899 | $209,894 | $220,389 | $231,408 | $242,978 | $255,127 | $267,884 | $281,278 | $295,342 |
| Less: Deducted Expenses | 55,469 | 57,780 | 60,203 | 62,743 | 65,405 | 68,197 | 71,126 | 74,198 | 77,421 | 80,803 |
| Less: Interest Expense | 123,690 | 122,968 | 122,171 | 121,290 | 120,317 | 119,242 | 118,054 | 116,742 | 115,293 | 113,692 |
| Less: Amortized Points | 620 | 620 | 620 | 620 | 620 | 620 | 620 | 620 | 620 | 620 |
| Less: Depreciation | 44,833 | 46,782 | 46,782 | 46,782 | 46,782 | 46,782 | 46,782 | 46,782 | 46,782 | 44,833 |
| Ordinary Income | ($34,231) | ($28,251) | ($19,882) | ($11,045) | ($1,716) | $8,138 | $18,546 | $29,542 | $41,163 | $55,394 |
| Taxable Income | 0 | 0 | 0 | 0 | 0 | 0 | 0 | 0 | 2,263 | 55,394 |
| (Cum Suspended Losses) | 34,231 | 62,483 | 82,364 | 93,410 | 95,125 | 86,987 | 68,442 | 38,899 | 0 | 0 |
| Taxes Due (- = Savings) | 0 | 0 | 0 | 0 | 0 | 0 | 0 | 0 | 702 | 17,172 |
| Cash Flow After Tax | $4,328 | $11,536 | $19,108 | $27,063 | $35,420 | $44,199 | $53,419 | $63,103 | $72,573 | $66,784 |
| Sale Proceeds: | ||||||||||
| Sale Value | $1,349,100 | $1,421,200 | $1,496,900 | $1,576,500 | $1,660,000 | $1,747,800 | $1,840,000 | $1,936,900 | $2,038,600 | $2,145,400 |
| Less: Sale Costs (7%) | 94,437 | 99,484 | 104,783 | 110,355 | 116,200 | 122,346 | 128,800 | 135,583 | 142,702 | 150,178 |
| Less: Loan Repayment | 1,233,107 | 1,225,492 | 1,217,080 | 1,207,787 | 1,197,521 | 1,186,180 | 1,173,652 | 1,159,811 | 1,144,522 | 1,127,631 |
| Sale Proceeds Before Tax | 21,556 | 96,224 | 175,037 | 258,358 | 346,279 | 439,274 | 537,548 | 641,506 | 751,376 | 867,591 |
| Less: Taxes due to Sale | (67,741) | (48,312) | (28,660) | (6,515) | 23,979 | 58,314 | 92,314 | 128,134 | 166,328 | 198,080 |
| Sale Proceeds After Tax | 89,297 | 144,536 | 203,696 | 264,872 | 322,300 | 380,959 | 445,234 | 513,372 | 585,048 | 669,511 |
| Ratio Analysis: | ||||||||||
| Profitability Ratios | ||||||||||
| Capitalization Rate | 8.70% | 9.17% | 9.66% | 10.17% | 10.71% | 11.28% | 11.87% | 12.50% | 13.15% | 13.84% |
| Cash on Cash Before Tax | 1.26% | 3.35% | 5.55% | 7.86% | 10.29% | 12.84% | 15.52% | 18.34% | 21.29% | 24.40% |
| Cash on Cash After Tax | 1.26% | 3.35% | 5.55% | 7.86% | 10.29% | 12.84% | 15.52% | 18.34% | 21.09% | 19.41% |
| Risk Ratios | ||||||||||
| Debt Coverage Ratio | 1.033 | 1.088 | 1.146 | 1.207 | 1.271 | 1.338 | 1.409 | 1.483 | 1.561 | 1.643 |
| Breakeven Occupancy | 92.8% | 89.5% | 86.4% | 83.3% | 80.5% | 77.7% | 75.1% | 72.6% | 70.3% | 68.0% |
| Loan Balance/Property Value | 91.4% | 86.2% | 81.3% | 76.6% | 72.1% | 67.9% | 63.8% | 59.9% | 56.1% | 52.6% |
| Assumption Ratios | ||||||||||
| NOI/Property Value | 10.00% | 10.00% | 10.00% | 10.00% | 10.00% | 10.00% | 10.00% | 10.00% | 10.00% | 10.00% |
| Gross Income Multiple | 6.73 | 6.75 | 6.78 | 6.80 | 6.81 | 6.83 | 6.85 | 6.87 | 6.89 | 6.90 |
| Operating Expense Ratio | 27.7% | 27.5% | 27.2% | 27.0% | 26.9% | 26.7% | 26.5% | 26.3% | 26.1% | 26.0% |
| Analysis Measures: | ||||||||||
| IRR Before Debt | 1.2% | 5.9% | 8.3% | 9.7% | 10.7% | 11.4% | 11.9% | 12.4% | 12.7% | |
| IRR Before Tax | 5.7% | 10.1% | 12.9% | 14.7% | 15.9% | 16.7% | ||||
| IRR After Tax | 4.4% | 8.1% | 10.6% | 12.4% | 13.7% | 14.6% |
This Statement is for the Los Amigos Apartments as acquired on 1 January 2001 for a Price of $1,550,000, subject to a Loan of $1,240,000, for a Down Payment of $310,000.
| 2001 | 2002 | 2003 | 2004 | 2005 | 2006 | 2007 | 2008 | 2009 | 2010 | |
| Gross Income | ||||||||||
| 1 Bedroom Units | 19.6% | 19.6% | 19.6% | 19.6% | 19.6% | 19.6% | 19.6% | 19.6% | 19.6% | 19.6% |
| 2 Bedroom Units | 78.6% | 78.6% | 78.6% | 78.6% | 78.6% | 78.6% | 78.6% | 78.6% | 78.6% | 78.6% |
| Laundry | 1.8% | 1.8% | 1.8% | 1.8% | 1.8% | 1.8% | 1.8% | 1.8% | 1.8% | 1.8% |
| Total Gross Income | 100.0% | 100.0% | 100.0% | 100.0% | 100.0% | 100.0% | 100.0% | 100.0% | 100.0% | 100.0% |
| Less: Vacancy & Credit Loss | 5.0% | 5.0% | 5.0% | 5.0% | 5.0% | 5.0% | 5.0% | 5.0% | 5.0% | 5.0% |
| Effective Income | 95.0% | 95.0% | 95.0% | 95.0% | 95.0% | 95.0% | 95.0% | 95.0% | 95.0% | 95.0% |
| Less: Operating Expenses | ||||||||||
| Property Taxes | 9.3% | 9.0% | 8.8% | 8.5% | 8.3% | 8.0% | 7.8% | 7.6% | 7.4% | 7.2% |
| Insurance | 1.5% | 1.5% | 1.5% | 1.5% | 1.5% | 1.5% | 1.5% | 1.5% | 1.5% | 1.5% |
| Pool | 0.6% | 0.6% | 0.6% | 0.6% | 0.6% | 0.6% | 0.6% | 0.6% | 0.6% | 0.6% |
| Gardener | 0.4% | 0.4% | 0.4% | 0.4% | 0.4% | 0.4% | 0.4% | 0.4% | 0.4% | 0.4% |
| Utilities | 2.4% | 2.4% | 2.5% | 2.5% | 2.6% | 2.6% | 2.7% | 2.7% | 2.8% | 2.8% |
| Resident Manager | 5.0% | 5.0% | 5.0% | 5.0% | 5.0% | 5.0% | 5.0% | 5.0% | 5.0% | 5.0% |
| Maintenance | 1.6% | 1.6% | 1.6% | 1.6% | 1.6% | 1.6% | 1.6% | 1.6% | 1.6% | 1.6% |
| Reserve | 1.6% | 1.6% | 1.6% | 1.6% | 1.6% | 1.6% | 1.6% | 1.6% | 1.6% | 1.6% |
| Miscellaneous | 0.6% | 0.6% | 0.6% | 0.6% | 0.6% | 0.6% | 0.6% | 0.6% | 0.6% | 0.6% |
| Management Fee | 4.8% | 4.8% | 4.8% | 4.8% | 4.8% | 4.8% | 4.8% | 4.8% | 4.8% | 4.8% |
| Total Operating Expenses | 27.7% | 27.5% | 27.2% | 27.0% | 26.9% | 26.7% | 26.5% | 26.3% | 26.1% | 26.0% |
| Net Operating Income | 67.3% | 67.5% | 67.8% | 68.0% | 68.1% | 68.3% | 68.5% | 68.7% | 68.9% | 69.0% |
| Less: Debt Service | 65.2% | 62.1% | 59.1% | 56.3% | 53.6% | 51.1% | 48.6% | 46.3% | 44.1% | 42.0% |
| Net Operating Cash Flow | 2.2% | 5.5% | 8.6% | 11.7% | 14.5% | 17.3% | 19.9% | 22.4% | 24.7% | 27.0% |
This Statement is for the Los Amigos Apartments as acquired on 1 January 2001 for a Price of $1,550,000, subject to a Loan of $1,240,000, for a Down Payment of $310,000.
| 2001 | 2002 | 2003 | 2004 | 2005 | 2006 | 2007 | 2008 | 2009 | 2010 | |
| Gross Income | ||||||||||
| 1 Bedroom Units (10 units) | $3,936 | $4,133 | $4,339 | $4,556 | $4,784 | $5,023 | $5,275 | $5,538 | $5,815 | $6,106 |
| 2 Bedroom Units (32 units) | 4,920 | 5,166 | 5,424 | 5,696 | 5,980 | 6,279 | 6,593 | 6,923 | 7,269 | 7,633 |
| Laundry | 86 | 90 | 95 | 99 | 104 | 109 | 115 | 121 | 127 | 133 |
| Total Gross Income | $4,771 | $5,010 | $5,261 | $5,524 | $5,800 | $6,090 | $6,394 | $6,714 | $7,050 | $7,402 |
| Less: Vacancy & Credit Loss | 239 | 251 | 263 | 276 | 290 | 304 | 320 | 336 | 352 | 370 |
| Effective Income | $4,533 | $4,760 | $4,997 | $5,247 | $5,510 | $5,785 | $6,074 | $6,378 | $6,697 | $7,032 |
| Less: Operating Expenses | ||||||||||
| Property Taxes | 443 | 452 | 461 | 470 | 479 | 489 | 499 | 509 | 519 | 529 |
| Insurance | 71 | 75 | 79 | 83 | 87 | 91 | 96 | 101 | 106 | 111 |
| Pool | 29 | 30 | 32 | 33 | 35 | 36 | 38 | 40 | 42 | 44 |
| Gardener | 18 | 19 | 20 | 21 | 22 | 23 | 24 | 25 | 26 | 28 |
| Utilities | 114 | 122 | 131 | 140 | 150 | 160 | 172 | 184 | 196 | 210 |
| Resident Manager | 238 | 250 | 263 | 276 | 289 | 304 | 319 | 335 | 352 | 369 |
| Maintenance | 76 | 80 | 84 | 88 | 93 | 97 | 102 | 107 | 113 | 118 |
| Reserve | 76 | 80 | 84 | 88 | 93 | 97 | 102 | 107 | 113 | 118 |
| Miscellaneous | 29 | 30 | 32 | 33 | 35 | 36 | 38 | 40 | 42 | 44 |
| Management Fee | 227 | 238 | 250 | 262 | 275 | 289 | 304 | 319 | 335 | 352 |
| Total Operating Expenses | $1,321 | $1,376 | $1,433 | $1,494 | $1,557 | $1,624 | $1,693 | $1,767 | $1,843 | $1,924 |
| Net Operating Income | $3,212 | $3,384 | $3,564 | $3,753 | $3,952 | $4,161 | $4,381 | $4,612 | $4,854 | $5,108 |
| Less: Debt Service | 3,109 | 3,109 | 3,109 | 3,109 | 3,109 | 3,109 | 3,109 | 3,109 | 3,109 | 3,109 |
| Net Operating Cash Flow | $103 | $275 | $455 | $644 | $843 | $1,052 | $1,272 | $1,502 | $1,745 | $1,999 |
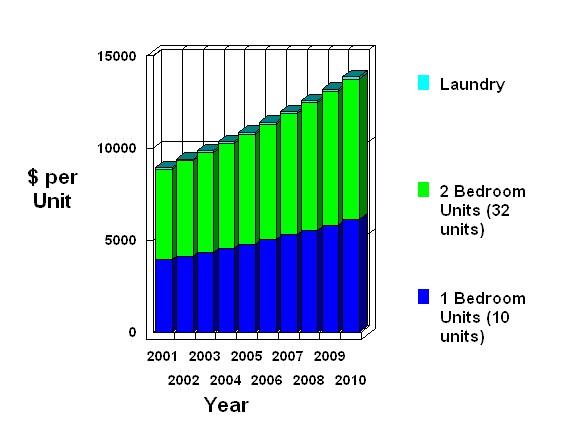
| 2001 | 2002 | 2003 | 2004 | 2005 | 2006 | 2007 | 2008 | 2009 | 2010 | |
| 1 Bedroom Units (10 units) | 3,936.0 | 4,133.0 | 4,339.0 | 4,556.0 | 4,784.0 | 5,023.0 | 5,275.0 | 5,538.0 | 5,815.0 | 6,106.0 |
| 2 Bedroom Units (32 units) | 4,920.0 | 5,166.0 | 5,424.0 | 5,696.0 | 5,980.0 | 6,279.0 | 6,593.0 | 6,923.0 | 7,269.0 | 7,633.0 |
| Laundry | 86.0 | 90.0 | 95.0 | 99.0 | 104.0 | 109.0 | 115.0 | 121.0 | 127.0 | 133.0 |
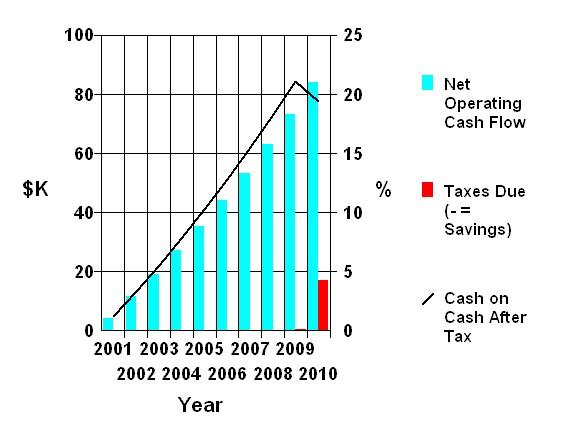
Cash on Cash After Tax is Net Operating Cash Flow less Taxes Due divided by Initial Equity.
| 2001 | 2002 | 2003 | 2004 | 2005 | 2006 | 2007 | 2008 | 2009 | 2010 | |
| Net Operating Cash Flow | 4.3 | 11.5 | 19.1 | 27.1 | 35.4 | 44.2 | 53.4 | 63.1 | 73.3 | 84.0 |
| Taxes Due (- = Savings) | 0.0 | 0.0 | 0.0 | 0.0 | 0.0 | 0.0 | 0.0 | 0.0 | 0.7 | 17.2 |
Internal Rate of Return (IRR)
The Internal Rate of Return (IRR) of an investment is defined as the Present Value Discount Rate that makes the Net Present Value of the Investment equal to zero.
You may think of the IRR as the annual Interest Rate or Yield (compounded annually) that the investment is paying you over the Holding Period. Naturally, the higher the yield, the better the investment.
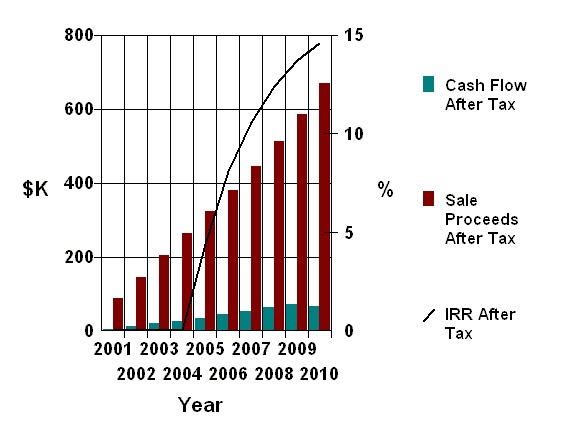
Unlike the ratios (current year only) the IRR takes into account all the before tax cash flows up to the time of calculation. For this reason the IRR is sometimes called the time value of money, because it not only takes into account the value but also the time necessary to create the value. In addition to the Cash Flow After Tax and the Sales Proceeds After Tax the initial equity is included in this measure.
| 2001 | 2002 | 2003 | 2004 | 2005 | 2006 | 2007 | 2008 | 2009 | 2010 | |
| Cash Flow After Tax | 4.3 | 11.5 | 19.1 | 27.1 | 35.4 | 44.2 | 53.4 | 63.1 | 72.6 | 66.8 |
| Sale Proceeds After Tax | 89.3 | 144.5 | 203.7 | 264.9 | 322.3 | 381.0 | 445.2 | 513.4 | 585.0 | 669.5 |
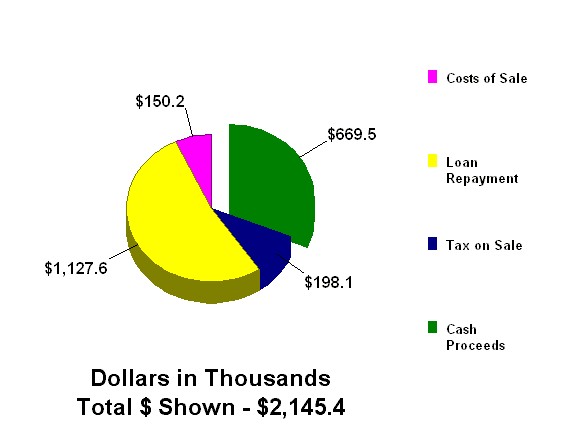
This report shows the results of a projected sale of the Los Amigos Apartments on 31 December 2010. The Sale Price of $2,145,400 is projected by using a Net Capitalization Rate of 10% on the projected Net Operating Income of $214,540 in effect at that time, according to the analysis assumptions.
| Analysis of Sale Proceeds | |||
| Sale Price (as discussed above) | $2,145,400 | ||
| - Costs of Sale (7%) | 150,178 | ||
| - Loan Balances | 1,127,631 | ||
| - Prepayment Penalties | 0 | ||
| Sale Proceeds Before Tax | $867,591 | ||
| Analysis of Capital Gain Results | |||
| Sale Price | $2,145,400 | ||
| - Capitalized Costs of Sale (100%) | 150,178 | ||
| Net Sale Price for Tax Purposes | $1,995,222 | ||
| Property Basis at Acquisition | $1,550,000 | ||
| + Capitalized Closing Costs (100%) | 15,500 | ||
| + Capital Additions | 0 | ||
| - Depreciation Taken | 463,920 | ||
| + Excess Depreciation Recaptured | 0 | ||
| Adjusted Basis at Sale | 1,101,580 | ||
| Capital Gain (or Loss) | $893,642 | ||
| - Suspended Passive Losses | 0 | ||
| Net Capital Gain (or Loss) | $893,642 | ||
| - Cost Recovery Recaptured | 463,920 | ||
| Adjusted Net Capital Gain (or Loss) | $429,722 | ||
| Cost Recovery Recapture Tax (@ 25%) | (115,980) | ||
| Tax on Adjusted Net Capital Gain (@ 20%) | (85,944) | ||
| Expenses Recognized at Sale | |||
| Expensed Costs of Sale | 0 | ||
| + Accrued Loan Interest | 0 | ||
| + Unamortized Points | 12,400 | ||
| + Prepayment Penalties | 0 | ||
| - Excess Depreciation Recaptured | 0 | ||
| Total Expenses Recognized at Sale | 12,400 | ||
| Tax Savings Due to Sale Expenses (@ 31%) | 3,844 | ||
| Net Taxable Income | $881,242 | ||
| After Tax Cash Proceeds of Sale | $669,511 |
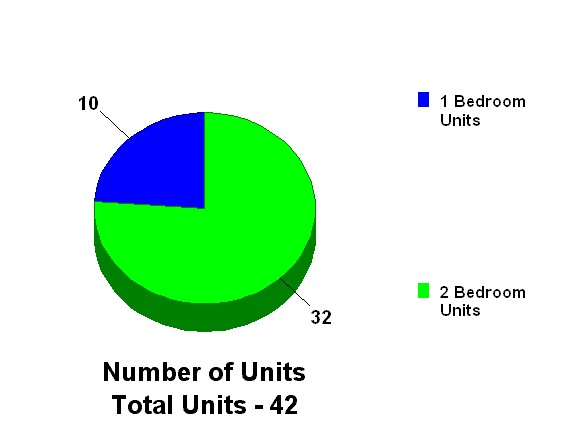
| Unit Description | SF | Units | Ttl SF | $/Year | $/Unit | $/SF |
| 1 Bedroom Units | 650 | 10 | 6,500 | 39,360 | 3,936 | 6.06 |
| Unit Description | SF | Units | Ttl SF | $/Year | $/Unit | $/SF |
| 2 Bedroom Units | 750 | 32 | 24,000 | 157,440 | 4,920 | 6.56 |
| Unit Description | SF | Units | Ttl SF | $/Year | $/Unit | $/SF |
| Laundry | 3,600 |
| Unit Description | SF | Units | Ttl SF | $/Year | $/Unit | $/SF |
| Totals | 42 | 30,500 | 200,400 | 4,771 | 6.57 |
| Unit Description | SF | Units | Ttl SF | $/Year | $/Unit | $/SF |
| 1 Bedroom Units | 650 | 10 | 6,500 | 61,060 | 6,106 | 9.39 |
| Unit Description | SF | Units | Ttl SF | $/Year | $/Unit | $/SF |
| 2 Bedroom Units | 750 | 32 | 24,000 | 244,241 | 7,633 | 10.18 |
| Unit Description | SF | Units | Ttl SF | $/Year | $/Unit | $/SF |
| Laundry | 5,585 |
| Unit Description | SF | Units | Ttl SF | $/Year | $/Unit | $/SF |
| Totals | 42 | 30,500 | 310,886 | 7,402 | 10.19 |
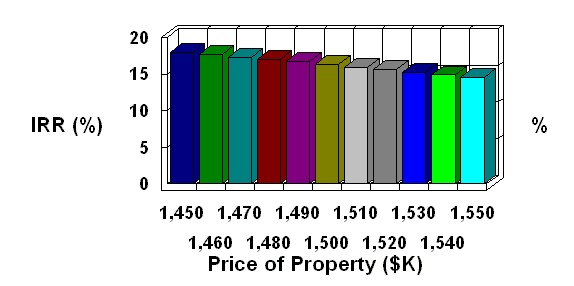
As you perform an analysis, planEASe measures the worth of the investment in terms of rates of return and net present values. Sensitivity Analysis allows you to investigate how these measures vary with a change in one of the assumptions. Any measure may be chosen for the Sensitivity Analysis, and any assumption may be chosen as well. Sensitivity Analysis provides a one page table and graph which describes the relationship between the assumption value and the resulting measure
Price of Property
versus
Rate of Return After Tax
| Assumption | IRR |
| $1,450,000.00 | 18.0% |
| $1,460,000.00 | 17.7% |
| $1,470,000.00 | 17.3% |
| $1,480,000.00 | 17.0% |
| $1,490,000.00 | 16.7% |
| $1,500,000.00 | 16.3% |
| $1,510,000.00 | 15.9% |
| $1,520,000.00 | 15.6% |
| $1,530,000.00 | 15.2% |
| $1,540,000.00 | 14.9% |
| $1,550,000.00 | 14.6% |
As you perform an analysis, planEASe measures the worth of the investment in terms of rates of return and net present values. Sensitivity Analysis allows you to investigate how these measures vary with a change in one of the assumptions. Any measure may be chosen for the Sensitivity Analysis, and any assumption may be chosen as well. Sensitivity Analysis provides a one page table and graph which describes the relationship between the assumption value and the resulting measure
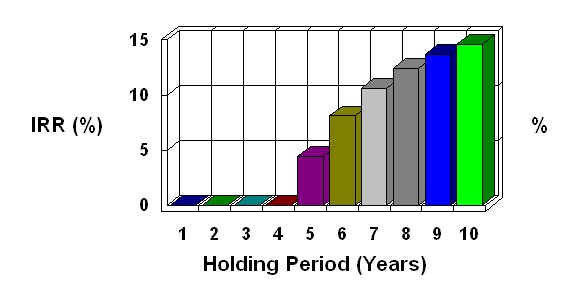
Holding Period
versus
Rate of Return After Tax
| Assumption | IRR |
| 1 Year | 0.0% |
| 2 Years | 0.0% |
| 3 Years | 0.0% |
| 4 Years | 0.0% |
| 5 Years | 4.4% |
| 6 Years | 8.1% |
| 7 Years | 10.6% |
| 8 Years | 12.4% |
| 9 Years | 13.7% |
| 10 Years | 14.6% |
As you perform an analysis, planEASe measures the worth of the investment in terms of rates of return and net present values. Sensitivity Analysis allows you to investigate how these measures vary with a change in one of the assumptions. Any measure may be chosen for the Sensitivity Analysis, and any assumption may be chosen as well. Sensitivity Analysis provides a one page table and graph which describes the relationship between the assumption value and the resulting measure
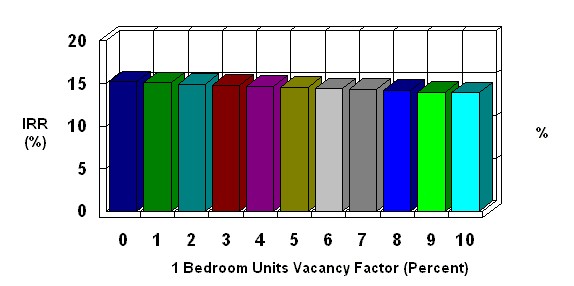
1 Bedroom Units Vacancy Factor
versus
Rate of Return After Tax
| Assumption | IRR |
| Zero | 15.2% |
| 1% | 15.1% |
| 2% | 14.9% |
| 3% | 14.8% |
| 4% | 14.7% |
| 5% | 14.6% |
| 6% | 14.4% |
| 7% | 14.3% |
| 8% | 14.2% |
| 9% | 14.0% |
| 10% | 13.9% |
As you perform an analysis, planEASe measures the worth of the investment in terms of rates of return and net present values. Risk Analysis allows you to investigate how these measures vary with a change in one or more of the assumptions. Any measure may be chosen for the Risk Analysis, and any group of assumptions may be chosen as well. Risk Analysis provides a one page table and graph which describes the relationship between the risky assumption values and the variability (or risk) of the resulting measure.
| Risk Analysis Assumption | Lowest | Likely | Highest |
| Inflation Rate | 4% per Year | 5% per Year | 6% per Year |
| Net Capitalization Rate at Sale | 9% Net Cap Rate | 10% Net Cap Rate | 11% Net Cap Rate |
| General Vacancy & Credit Loss | 3% per Year | 7% per Year | 10% per Year |
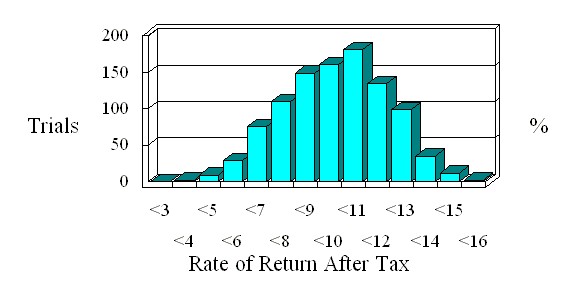
| Average IRR | 9.7% | Lowest IRR | 3.1% | Standard Deviation | 2.1% | Highest IRR | 15.1% |
produces a report showing (in English) the assumptions used to generate the other reports. It was created with the idea of generating an assumptions report which can be presented to an investor or other concerned party to explain the assumptive basis of the other planEASe reports.
| Investment Assumptions | ||
| Price of Property | $1,550,000.00 | |
| Closing Costs | 1% of Property Price | |
| Date of Acquisition | 1 January 2001 | |
| Holding Period | 10 Years | |
| Inflation Rate | 5% per Year | |
| Sale Price Method | 10% Capitalization of NOI on Sale Date | |
| Selling Costs | 7% | |
| Investor's Assumptions | ||
| General Vacancy & Credit Loss | Zero | |
| Tax Rate - First Year | 31% | |
| Tax Rate - Following Years | 31% | |
| Capital Gain Rate | 20% | |
| Cost Recovery Recapture Rate | 25% - Losses Carried Forward | |
| Present Value Discount Rate Before Debt | 12% per Year | |
| Present Value Discount Rate Before Tax | 12% per Year | |
| Present Value Discount Rate After Tax | 12% per Year | |
| Building Depreciation Assumptions | ||
|
||
| Depreciable Amount | 83% of Property Price | |
| Depreciable Life | 27.5 Years | |
| Depreciation Method | Straight Line | |
| Depreciation Start Date | at Acquisition | |
| Bank of America Loan Assumptions | ||
|
||
| Loan Amount | 80% of Property Price | |
| Loan Interest Rate | 10% Annually | |
| Original Loan Period | 30 Years | |
| Loan Origination Date | at Acquisition | |
| Loan Type | Monthly Payments, Amortizing | |
| Loan Points Charged | 1.5 Points, Amortized over Loan Life | |
| 1 Bedroom Units Revenue Assumptions | ||
| Annual Revenue (10 Units @ $328.00/Unit/Month) | $39,360.00 | |
| Revenue Start Date | at Acquisition | |
| Revenue Period | Until Projected Sale | |
| Revenue Growth Method | Annual at the Inflation Rate | |
| Management Fee | 5% | |
| Vacancy Factor | 5% | |
| 2 Bedroom Units Revenue Assumptions | ||
| Annual Revenue (32 Units @ $410.00/Unit/Month) | $157,440.00 | |
| Revenue Start Date | at Acquisition | |
| Revenue Period | Until Projected Sale | |
| Revenue Growth Method | Annual at the Inflation Rate | |
| Management Fee | 5% | |
| Vacancy Factor | 5% | |
| Laundry Revenue Assumptions | ||
| Annual Revenue | $3,600.00 | |
| Revenue Start Date | at Acquisition | |
| Revenue Period | Until Projected Sale | |
| Revenue Growth Method | Annual at the Inflation Rate | |
| Management Fee | 5% | |
| Vacancy Factor | 5% | |
| Property Taxes Expense Assumptions | ||
|
||
| Annual Expense | 1.2% of Property Price | |
| Expense Start Date | at Acquisition | |
| Expense Period | Until Projected Sale | |
| Expense Growth Method | Annual at 2% Annually | |
| Insurance Expense Assumptions | ||
| Annual Expense | $3,000.00 | |
| Expense Start Date | at Acquisition | |
| Expense Period | Until Projected Sale | |
| Expense Growth Method | Annual at the Inflation Rate | |
| Pool Expense Assumptions | ||
| Annual Expense | $1,200.00 | |
| Expense Start Date | at Acquisition | |
| Expense Period | Until Projected Sale | |
| Expense Growth Method | Annual at the Inflation Rate | |
| Gardener Expense Assumptions | ||
| Annual Expense | $750.00 | |
| Expense Start Date | at Acquisition | |
| Expense Period | Until Projected Sale | |
| Expense Growth Method | Annual at the Inflation Rate | |
| Utilities Expense Assumptions | ||
| Annual Expense | $4,800.00 | |
| Expense Start Date | at Acquisition | |
| Expense Period | Until Projected Sale | |
| Expense Growth Method | Annual at 2% Over Inflation | |
| Resident Manager Expense Assumptions | ||
| Annual Expense | $10,000.00 | |
| Expense Start Date | at Acquisition | |
| Expense Period | Until Projected Sale | |
| Expense Growth Method | Annual at the Inflation Rate | |
| Maintenance Expense Assumptions | ||
| Annual Expense | $3,200.00 | |
| Expense Start Date | at Acquisition | |
| Expense Period | Until Projected Sale | |
| Expense Growth Method | Annual at the Inflation Rate | |
| Reserve Expense Assumptions | ||
|
||
| Annual Expense | $3,200.00 | |
| Expense Start Date | at Acquisition | |
| Expense Period | Until Projected Sale | |
| Expense Growth Method | Annual at the Inflation Rate | |
| Miscellaneous Expense Assumptions | ||
| Annual Expense | $1,200.00 | |
| Expense Start Date | at Acquisition | |
| Expense Period | Until Projected Sale | |
| Expense Growth Method | Annual at the Inflation Rate | |