Back to Build to Suit Index - planEASe Home Page
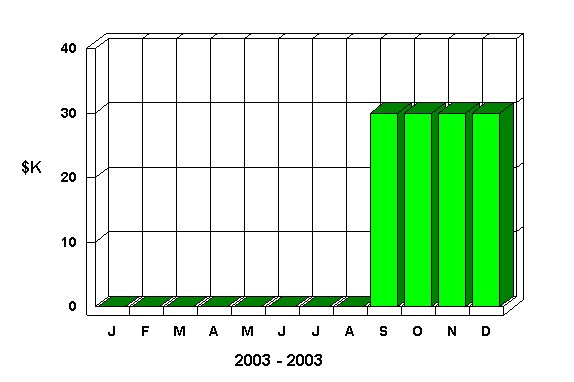
Shows the first year on a monthly basis. Highlights the construction phase of the analysis.
| Jan 03 | Feb 03 | Mar 03 | Apr 03 | May 03 | Jun 03 | Jul 03 | Aug 03 | Sep 03 | Oct 03 | Nov 03 | Dec 03 | Ttl 03 | |
| Gross Income | |||||||||||||
| XYZ Lease | $0 | $0 | $0 | $0 | $0 | $0 | $0 | $0 | $30,000 | $30,000 | $30,000 | $30,000 | $120,000 |
| Total Gross Income | $0 | $0 | $0 | $0 | $0 | $0 | $0 | $0 | $30,000 | $30,000 | $30,000 | $30,000 | $120,000 |
| Less: Operating Expenses | |||||||||||||
| Management Fee | 0 | 0 | 0 | 0 | 0 | 0 | 0 | 0 | 900 | 900 | 900 | 900 | 3,600 |
| Total Operating Expenses | $0 | $0 | $0 | $0 | $0 | $0 | $0 | $0 | $900 | $900 | $900 | $900 | $3,600 |
| Net Operating Income | $0 | $0 | $0 | $0 | $0 | $0 | $0 | $0 | $29,100 | $29,100 | $29,100 | $29,100 | $116,400 |
| Less: Debt Service | |||||||||||||
| Permanent | 0 | 0 | 0 | 0 | 0 | 0 | 0 | 0 | 17,289 | 17,289 | 17,289 | 17,289 | 69,156 |
| Total Debt Service | $0 | $0 | $0 | $0 | $0 | $0 | $0 | $0 | $17,289 | $17,289 | $17,289 | $17,289 | $69,156 |
| Net Operating Cash Flow | $0 | $0 | $0 | $0 | $0 | $0 | $0 | $0 | $11,811 | $11,811 | $11,811 | $11,811 | $47,244 |
| Add: Debt Draw & Repay | |||||||||||||
| Construction Draw | 0 | 78,000 | 591,600 | 306,000 | 399,600 | 255,600 | 45,600 | 230,400 | (1,970,095) | 0 | 0 | 0 | (63,295) |
| Permanent | 0 | 0 | 0 | 0 | 0 | 0 | 0 | 0 | 1,970,095 | 0 | 0 | 0 | 1,970,095 |
| Total Debt Draw & Repay | $0 | $78,000 | $591,600 | $306,000 | $399,600 | $255,600 | $45,600 | $230,400 | $0 | $0 | $0 | $0 | $1,906,800 |
| Less: Capital Spending | |||||||||||||
| Land | 0 | 0 | 1,200,000 | 0 | 0 | 0 | 0 | 0 | 0 | 0 | 0 | 0 | 1,200,000 |
| Sitework | 0 | 0 | 302,400 | 0 | 0 | 0 | 0 | 0 | 0 | 0 | 0 | 0 | 302,400 |
| Foundations & Floor Slab | 0 | 0 | 289,200 | 0 | 0 | 0 | 0 | 0 | 0 | 0 | 0 | 0 | 289,200 |
| Structure | 0 | 0 | 0 | 306,000 | 0 | 0 | 0 | 0 | 0 | 0 | 0 | 0 | 306,000 |
| Building Skin | 0 | 0 | 0 | 0 | 261,600 | 0 | 0 | 0 | 0 | 0 | 0 | 0 | 261,600 |
| Doors, Canopies, Soffits | 0 | 0 | 0 | 0 | 58,800 | 0 | 0 | 0 | 0 | 0 | 0 | 0 | 58,800 |
| Storefront | 0 | 0 | 0 | 0 | 0 | 49,200 | 0 | 0 | 0 | 0 | 0 | 0 | 49,200 |
| Roof Systems | 0 | 0 | 0 | 0 | 0 | 206,400 | 0 | 0 | 0 | 0 | 0 | 0 | 206,400 |
| Electrical | 0 | 0 | 0 | 0 | 0 | 0 | 33,600 | 0 | 0 | 0 | 0 | 0 | 33,600 |
| Exterior Contingency | 0 | 0 | 0 | 0 | 79,200 | 0 | 0 | 0 | 0 | 0 | 0 | 0 | 79,200 |
| Warehouse Finish | 0 | 0 | 0 | 0 | 0 | 0 | 0 | 110,400 | 0 | 0 | 0 | 0 | 110,400 |
| Standard Office Finish | 0 | 0 | 0 | 0 | 0 | 0 | 0 | 120,000 | 0 | 0 | 0 | 0 | 120,000 |
| Interior Contingency | 0 | 0 | 0 | 0 | 0 | 0 | 12,000 | 0 | 0 | 0 | 0 | 0 | 12,000 |
| Permits | 0 | 10,000 | 0 | 0 | 0 | 0 | 0 | 0 | 0 | 0 | 0 | 0 | 10,000 |
| Legal & Title | 0 | 18,000 | 0 | 0 | 0 | 0 | 0 | 0 | 0 | 0 | 0 | 0 | 18,000 |
| Architectural/Engineering | 0 | 50,000 | 0 | 0 | 0 | 0 | 0 | 0 | 0 | 0 | 0 | 0 | 50,000 |
| Total Capital Spending | $0 | $78,000 | $1,791,600 | $306,000 | $399,600 | $255,600 | $45,600 | $230,400 | $0 | $0 | $0 | $0 | $3,106,800 |
| Cash Flow Before Tax | $0 | $0 | ($1,200,000) | $0 | $0 | $0 | $0 | $0 | $11,811 | $11,811 | $11,811 | $11,811 | ($1,152,756) |
| Taxable Income and Taxes | |||||||||||||
| (Losses Carried Forward) | |||||||||||||
| Taxable Revenues | $0 | $0 | $0 | $0 | $0 | $0 | $0 | $0 | $30,000 | $30,000 | $30,000 | $30,000 | $120,000 |
| Less: Deducted Expenses | 0 | 0 | 0 | 0 | 0 | 0 | 0 | 0 | 900 | 900 | 900 | 900 | 3,600 |
| Less: Interest Expense | |||||||||||||
| Permanent | 0 | 0 | 0 | 0 | 0 | 0 | 0 | 0 | 16,417 | 16,410 | 16,403 | 16,395 | 65,626 |
| Total Interest Expense | $0 | $0 | $0 | $0 | $0 | $0 | $0 | $0 | $16,417 | $16,410 | $16,403 | $16,395 | $65,626 |
| Ordinary Income | $0 | $0 | $0 | $0 | $0 | $0 | $0 | $0 | $12,683 | $12,690 | $12,697 | $12,705 | $50,774 |
| Taxable Income | 0 | 0 | 0 | 0 | 0 | 0 | 0 | 0 | 12,683 | 12,690 | 12,697 | 12,705 | 50,774 |
| (Cum Suspended Losses) | 0 | 0 | 0 | 0 | 0 | 0 | 0 | 0 | 0 | 0 | 0 | 0 | 0 |
| Taxes Due (- = Savings) | 0 | 0 | 0 | 0 | 0 | 0 | 0 | 0 | 5,022 | 5,025 | 5,028 | 5,031 | 20,106 |
| Cash Flow After Tax | $0 | $0 | ($1,200,000) | $0 | $0 | $0 | $0 | $0 | $6,789 | $6,786 | $6,783 | $6,780 | ($1,172,862) |
Illustrates the schedule of development spending for the Build to Suit development.
Tracks the construction draw into the permanent loan. The land is being paid for with cash and is not included in the draws. When the property goes into service, the draws are repaid with the funds of a permanent loan. planEASe does this all automatically.
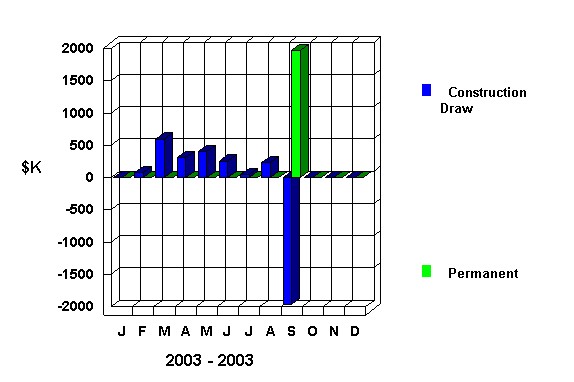
The lease starts in September when the building goes into service.