Lease/Buy Analysis
This is a simple Lease vs.
Buy case. For this analysis to work the one client is deciding to lease or buy
one property only. If there are more choices, or the possibility of more
choices, use the cost comparison process. In this case the client is going to
use this property for business. The choice is whether to lease or buy the space.
Buying the property requires a down payment and loan payments. Leasing does not
require a down payment, but the amount of the lease payments are greater than
the loan service costs. Should the client use the down payment to buy the
property or should the client use that down payment amount in some other
investment? It is a better
decision to lease and invest the down payment in another investment when the
other investment returns more money than would be saved by buying the property.
If the other investment does not return more money than would be saved, then it
is better to buy the property. Sounds simple! Remember that the assumptions
that lead to any conclusion can change. The advantage that planEASe delivers is
not only ease of use, but the ability to vary the assumptions to make the most
informed decision possible. In this particular sample, the lease calls for all
expenses to be paid for by the tenant. This means the expenses are the same in
either case. This means they are a wash, and need not be included in the
analysis.
Analysis Assumptions Report
Lease/Buy Analysis
produces a report showing (in English) the assumptions used to generate the other reports. It was created with the idea of generating an assumptions report which can be presented to an investor or other concerned party to explain the assumptive basis of the other planEASe reports.
|
Investment Assumptions |
||
|
Price of Property |
|
$1,000,000.00 |
|
Closing Costs |
|
2% of Property Price |
|
Date of Acquisition |
|
1 January 2010 |
|
Holding Period |
|
10 Years |
|
Inflation Rate |
|
5% per Year |
|
Sale Price Method |
|
Continuous Growth at Inflation Rate |
|
Selling Costs |
|
6% |
|
|
|
|
|
Investor's Assumptions |
||
|
General Vacancy & Credit Loss |
|
Zero |
|
Tax Rate - First Year |
|
34% |
|
Tax Rate - Following Years |
|
34% |
|
Capital Gain Rate |
|
34% |
|
Cost Recovery Recapture Rate |
|
34% - Losses Taken Currently |
|
Present Value Discount Rate Before Debt |
|
12% per Year |
|
Present Value Discount Rate Before Tax |
|
12% per Year |
|
Present Value Discount Rate After Tax |
|
12% per Year |
|
|
|
|
|
Building Depreciation Assumptions |
||
|
Depreciable Amount |
|
75% of Property Price |
|
Depreciable Life |
|
39 Years |
|
Depreciation Method |
|
Straight Line |
|
Depreciation Start Date |
|
at Acquisition |
|
|
|
|
|
New First Loan Assumptions |
||
|
Loan Amount |
|
80% of Property Price |
|
Loan Interest Rate |
|
10.5% Annually |
|
Original Loan Period |
|
30 Years |
|
Loan Origination Date |
|
at Acquisition |
|
Loan Type |
|
Monthly Payments, Amortizing |
|
Loan Points Charged |
|
1.5 Points, Amortized over Loan Life |
|
|
|
|
|
Lease Payment Revenue Assumptions |
||
|
Annual Revenue |
|
$93,000.00 |
|
Revenue Start Date |
|
at Acquisition |
|
Revenue Period |
|
Until Projected Sale |
|
Revenue Growth Method |
|
Annual at the Inflation Rate |
|
|
|
|
|
|
|
|
Before Tax Cash Flow Projection
Lease/Buy Analysis
details the results of the analysis. Produces the return on savings by purchasing the property (the point of indifference). Both before and after tax returns are shown.
|
|
Investment |
Effective |
Operating |
Cash Flow |
Debt |
Cash Flow |
|
Buy |
(1,020,000) |
0 |
0 |
(1,020,000) |
788,000 |
(232,000) |
|
2010 |
0 |
93,000 |
0 |
93,000 |
(87,815) |
5,185 |
|
2011 |
0 |
97,650 |
0 |
97,650 |
(87,815) |
9,835 |
|
2012 |
0 |
102,533 |
0 |
102,533 |
(87,815) |
14,717 |
|
2013 |
0 |
107,659 |
0 |
107,659 |
(87,815) |
19,844 |
|
2014 |
0 |
113,042 |
0 |
113,042 |
(87,815) |
25,227 |
|
2015 |
0 |
118,694 |
0 |
118,694 |
(87,815) |
30,879 |
|
2016 |
0 |
124,629 |
0 |
124,629 |
(87,815) |
36,814 |
|
2017 |
0 |
130,860 |
0 |
130,860 |
(87,815) |
43,045 |
|
2018 |
0 |
137,403 |
0 |
137,403 |
(87,815) |
49,588 |
|
2019 |
0 |
144,274 |
0 |
144,274 |
(87,815) |
56,458 |
|
Sell |
1,531,161 |
0 |
0 |
1,531,161 |
(732,978) |
798,184 |
|
Total |
511,161 |
1,169,744 |
0 |
1,680,905 |
(823,128) |
857,777 |
|
Rate of Return Before Debt (IRR) |
14.3% |
|
Rate of Return Before Tax (IRR) |
19.6% |
|
Net Present Value Before Debt @12% |
141,970 |
|
Net Present Value Before Tax @12% |
168,590 |
|
|
|
|
Taxable Income Projection
Lease/Buy Analysis
details the results of the analysis. Produces the return on savings by purchasing the property (the point of indifference). Both before and after tax returns are shown.
|
|
Taxable |
Taxable |
Interest |
Depre- |
Ordinary |
|
Buy |
0 |
0 |
0 |
0 |
0 |
|
2010 |
93,000 |
0 |
(84,211) |
(18,429) |
(9,640) |
|
2011 |
97,650 |
0 |
(83,770) |
(19,231) |
(5,350) |
|
2012 |
102,533 |
0 |
(83,280) |
(19,231) |
22 |
|
2013 |
107,659 |
0 |
(82,736) |
(19,231) |
5,692 |
|
2014 |
113,042 |
0 |
(82,132) |
(19,231) |
11,679 |
|
2015 |
118,694 |
0 |
(81,462) |
(19,231) |
18,002 |
|
2016 |
124,629 |
0 |
(80,717) |
(19,231) |
24,681 |
|
2017 |
130,860 |
0 |
(79,891) |
(19,231) |
31,738 |
|
2018 |
137,403 |
0 |
(78,974) |
(19,231) |
39,199 |
|
2019 |
144,274 |
0 |
(77,955) |
(18,429) |
47,889 |
|
Sell |
0 |
0 |
(8,000) |
0 |
(8,000) |
|
Total |
1,169,744 |
0 |
(823,128) |
(190,705) |
155,911 |
|
|
|
|
After Tax Cash Flow Projection
Lease/Buy Analysis
details the results of the analysis. Produces the return on savings by purchasing the property (the point of indifference). Both before and after tax returns are shown.
|
|
Cash Flow |
Ordinary |
Capital |
Taxable |
|
Cash Flow |
|
Buy |
(232,000) |
0 |
0 |
0 |
0 |
(232,000) |
|
2010 |
5,185 |
(9,640) |
0 |
(9,640) |
3,278 |
8,463 |
|
2011 |
9,835 |
(5,350) |
0 |
(5,350) |
1,819 |
11,654 |
|
2012 |
14,717 |
22 |
0 |
22 |
(7) |
14,710 |
|
2013 |
19,844 |
5,692 |
0 |
5,692 |
(1,935) |
17,909 |
|
2014 |
25,227 |
11,679 |
0 |
11,679 |
(3,971) |
21,256 |
|
2015 |
30,879 |
18,002 |
0 |
18,002 |
(6,121) |
24,759 |
|
2016 |
36,814 |
24,681 |
0 |
24,681 |
(8,391) |
28,422 |
|
2017 |
43,045 |
31,738 |
0 |
31,738 |
(10,791) |
32,254 |
|
2018 |
49,588 |
39,199 |
0 |
39,199 |
(13,328) |
36,261 |
|
2019 |
56,458 |
47,889 |
0 |
47,889 |
(16,282) |
40,176 |
|
Sell |
798,184 |
(8,000) |
701,866 |
693,866 |
(235,915) |
562,269 |
|
Total |
857,777 |
155,911 |
701,866 |
857,777 |
(291,644) |
566,133 |
|
Rate of Return Before Tax (IRR) |
19.6% |
|
Rate of Return After Tax (IRR) |
15.9% |
|
Net Present Value Before Tax @12% |
168,590 |
|
Net Present Value After Tax @12% |
71,027 |
|
|
|
|
Sensitivity Analysis
Lease/Buy Analysis
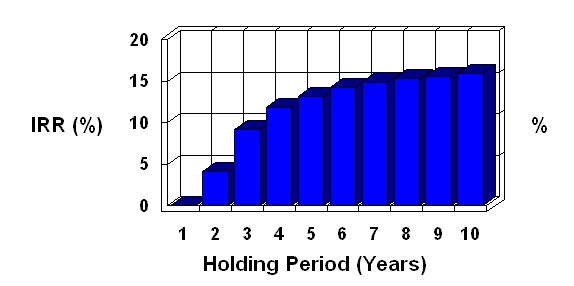
As you perform an analysis, planEASe measures the worth of the investment in terms of rates of return and net present values. Sensitivity Analysis allows you to investigate how these measures vary with a change in one of the assumptions. Any measure may be chosen for the Sensitivity Analysis, and any assumption may be chosen as well. Sensitivity Analysis provides a one page table and graph which describes the relationship between the assumption value and the resulting measure.
Holding
Period
versus
Rate of Return After Tax
|
Assumption |
IRR |
|
1 Year |
0.0% |
|
2 Years |
4.1% |
|
3 Years |
9.2% |
|
4 Years |
11.8% |
|
5 Years |
13.2% |
|
6 Years |
14.2% |
|
7 Years |
14.9% |
|
8 Years |
15.3% |
|
9 Years |
15.6% |
|
10 Years |
15.9% |

|
|
|
|
Sensitivity Analysis
Lease/Buy Analysis
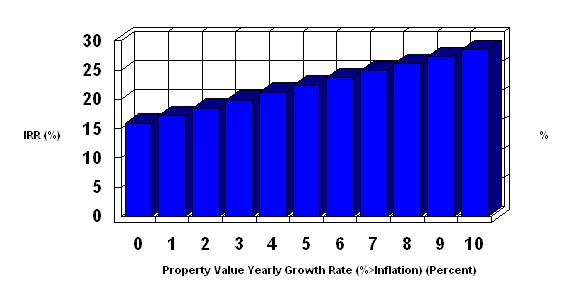
As you perform an analysis, planEASe measures the worth of the investment in terms of rates of return and net present values. Sensitivity Analysis allows you to investigate how these measures vary with a change in one of the assumptions. Any measure may be chosen for the Sensitivity Analysis, and any assumption may be chosen as well. Sensitivity Analysis provides a one page table and graph which describes the relationship between the assumption value and the resulting measure.
Property
Value Yearly Growth Rate (%>Inflation)
versus
Rate of Return After Tax
|
Assumption |
IRR |
|
At the Inflation Rate |
15.9% |
|
1% Over Inflation |
17.2% |
|
2% Over Inflation |
18.5% |
|
3% Over Inflation |
19.9% |
|
4% Over Inflation |
21.2% |
|
5% Over Inflation |
22.4% |
|
6% Over Inflation |
23.7% |
|
7% Over Inflation |
24.9% |
|
8% Over Inflation |
26.1% |
|
9% Over Inflation |
27.3% |
|
10% Over Inflation |
28.5% |

|
|
|
|
Sensitivity Analysis
Lease/Buy Analysis
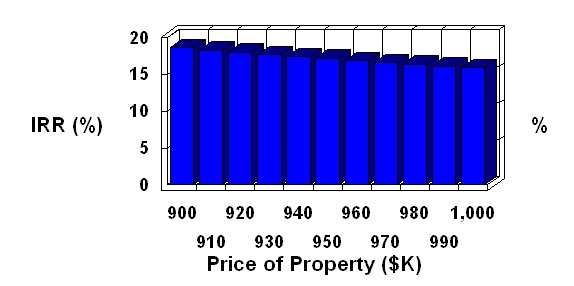
As you perform an analysis, planEASe measures the worth of the investment in terms of rates of return and net present values. Sensitivity Analysis allows you to investigate how these measures vary with a change in one of the assumptions. Any measure may be chosen for the Sensitivity Analysis, and any assumption may be chosen as well. Sensitivity Analysis provides a one page table and graph which describes the relationship between the assumption value and the resulting measure.
Price
of Property
versus
Rate of Return After Tax
|
Assumption |
IRR |
|
$900,000.00 |
18.6% |
|
$910,000.00 |
18.3% |
|
$920,000.00 |
18.0% |
|
$930,000.00 |
17.7% |
|
$940,000.00 |
17.4% |
|
$950,000.00 |
17.2% |
|
$960,000.00 |
16.9% |
|
$970,000.00 |
16.6% |
|
$980,000.00 |
16.4% |
|
$990,000.00 |
16.1% |
|
$1,000,000.00 |
15.9% |

|
|
|
|