Lease Analysis (PV, Rentable Square Feet)
Creates summary and detail reports for leases in a Retail, Office, or Industrial analysis as well as lease abstracts for individual leases. Lease Analysis is also used to prepare Tenant Representation and Owner Representation presentations. Measures computed include Dollars, Present Value, Rentable Square Feet ($/RSF), and Usable Square Feet ($/USF).
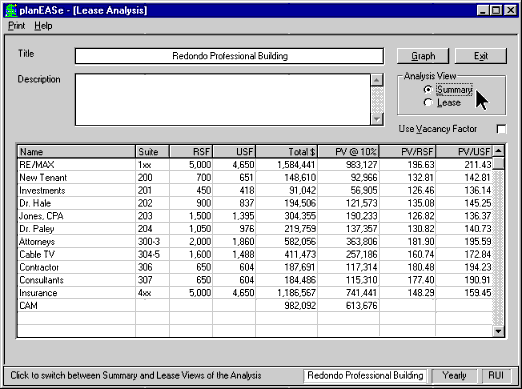
Lease Analysis is automatically produced from the Revenue Pages in your Assumption
Set, as shown here (in
Summary View) for the
Redondo Professional Building,
an investment on your planEASe System Disk saved under the Assumption Set name "OFFICES".
Leases can be sorted in ascending / descending order on any column’s values by left
/ right clicking the column header.
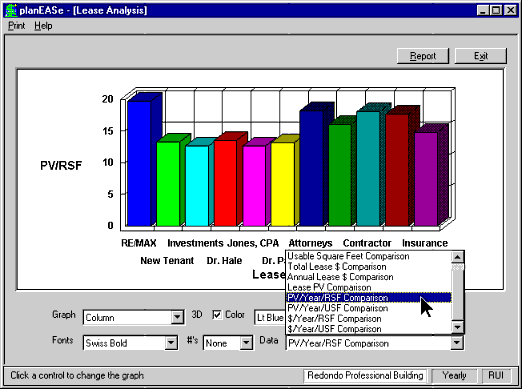
Graphs are available here on the Graph Button at the top right (if you have purchased
the optional
Graphics Extension), as shown below.
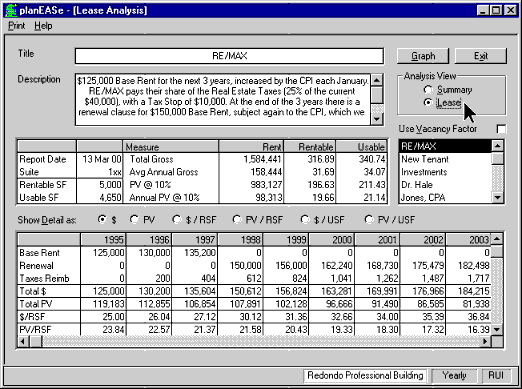
Lease View in Lease Analysis (below, as opposed to the Summary View shown above)
shows each individual lease you choose from the list at the middle screen right.
Checking the
Use Vacancy Factor checkbox toggles between Gross and Effective
values. Suite Number is obtained from the Page Title of the first assumption page
of the lease, if it begins with a number (all text through the first space is assumed
to be a Suite Number). The
Page Notes for the first page of the lease are
automatically entered in the
Description text and may be updated and saved
with your Assumption Set if you wish. The text in the Description box prints in
the Lease Analysis Report. Clicking on one of the
Show Detail as buttons
(in the middle of the screen) changes the detail lines in the lower grid from the
$ shown below to PV, $/RSF, PV/RSF, etc. You can print single leases or all the
leases at once. If you have purchased the
Monthly Extension, these projections
can be shown monthly or quarterly.
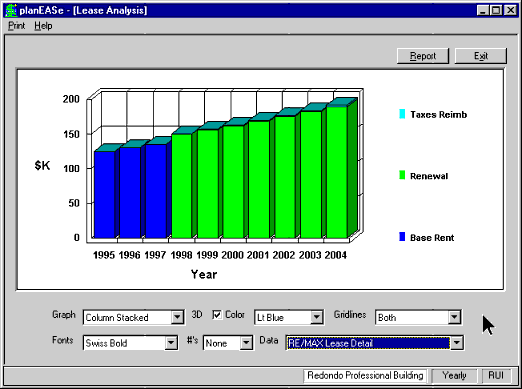
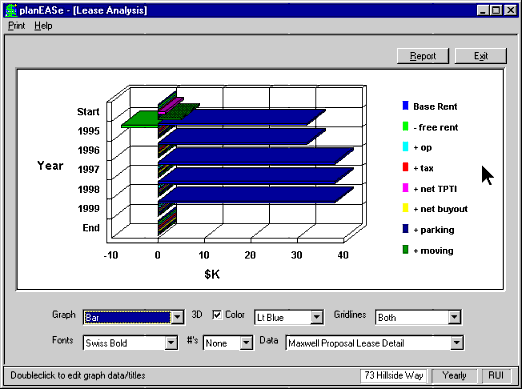
Graphs are available here on the Graph Button at the top right (if you have purchased
the optional
Graphics Extension), as shown below.
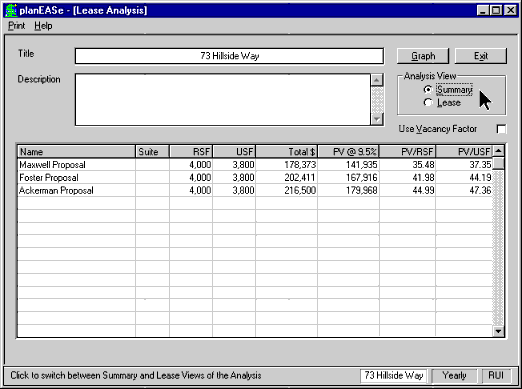
The Lease Analysis function may also be used for Tenant Representation and Owner
Representation analysis and presentation. This Summary View of
73 Hillside Way,
a tenant representation Assumption Set on your planEASe System Disk saved under
the name "TENANT". shows three proposals side-by-side for comparison purposes, making
it very clear that the Maxwell Proposal is the most attractive from the Tenant perspective.
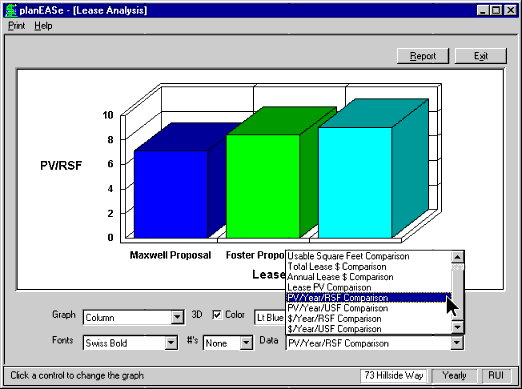
If you have purchased the
Graphics Extension, the
Graph button will
be present, and you may press it to choose between several available graphs comparing
the proposals.
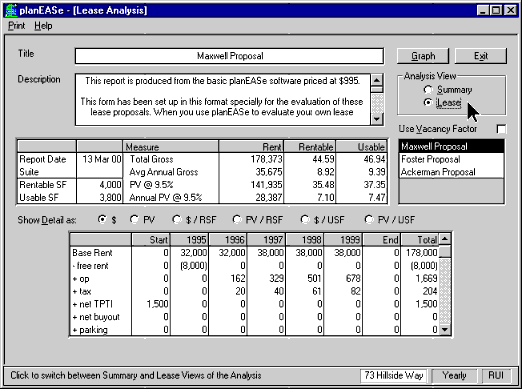
In Lease View, as shown here, note that the
Maxwell Proposal shows a
Start
and
End column for the lease projection. If you specify Tenant or Owner Representation
in your Assumption Set (by entering a 1 or 2 in the
Price of Property), these
columns are shown in Lease View. You may enter starting and stopping values for
an item by specifying one-time growth and either 0 for
Start or 99 for
End
in the Revenue Start Date (see the TENANT Assumption Set for the
73 Hillside Way
example).
Creates summary and detail reports for leases in a Retail, Office, or Industrial analysis as well as lease abstracts for individual leases. Lease Analysis is also used to prepare Tenant Representation and Owner Representation presentations. Measures computed include Dollars, Present Value, Rentable Square Feet ($/RSF), and Usable Square Feet ($/USF).