Installment Sale Report
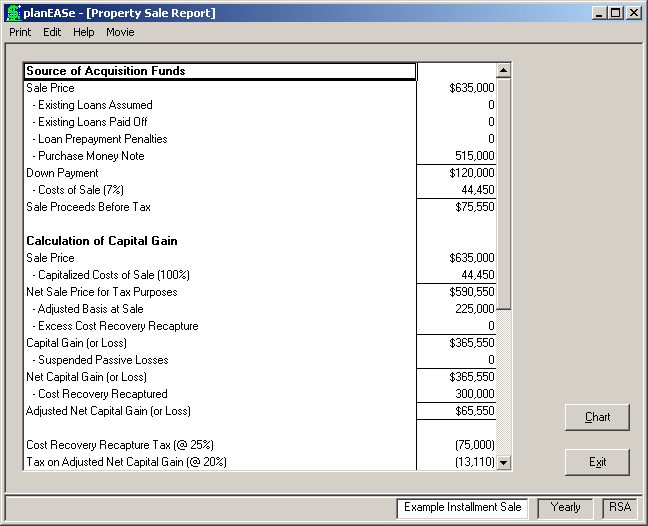
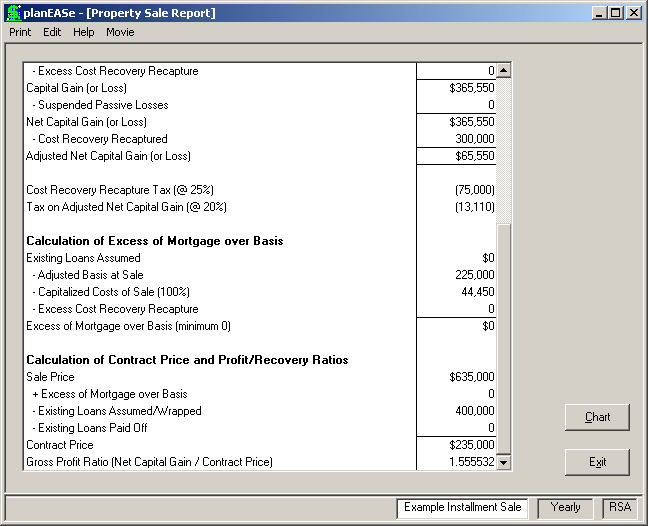
This report shows the detail of the major ele- ments of the Installment Sale used to make the Installment Sale Projection. The two screens here show the same report (for the Example Installment Sale) with the second screen scrolled to show the bottom of the report (not visible in the first screen).
Sale Proceeds Before Tax is detailed in the Source of Acquisition Funds area at the top of the report. This amount ($75,550) ties exactly to the Cash Flow Before Tax at Sale in the Install- ment Sale Projection.
The Calculation of Capital Gain area shows the total amount of Cost Recovery Recapture and Net Capital Gain (and taxes on those amounts) allocated to the years in the Install- ment Sale Projection.
The sum of Excess of Mortgage over Basis (0) and the Down Payment ($120,000) shown here constitutes the Principal Received at Sale in the Installment Sale Projection.
The Gross Profit Ratio computed here is used to compute the Recovery Recapture and Net Capital Gain amounts for each time period in the Installment Sale Projection. If Tax is paid Pro Rata, the Profit and Recovery Ratios are shown here.
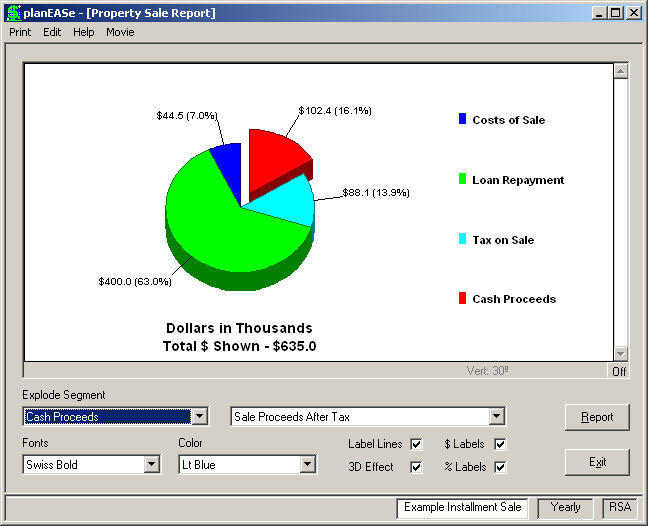
If you have purchased the optional Graphics Extension , this Pie Chart of Sale Proceeds after tax is available by pressing the Chart button. It shows the after tax cash results of the same sale without the Installment provisions. Note the Cash Proceeds are shown as $102.4K, whereas the NPV After Tax in the Installment Sale Projection is $117.8K, so wrapping the $400K loan into an installment sale buys the seller an immediate $15.4K increase in Present Value.