Before Tax Cash Flow Projection
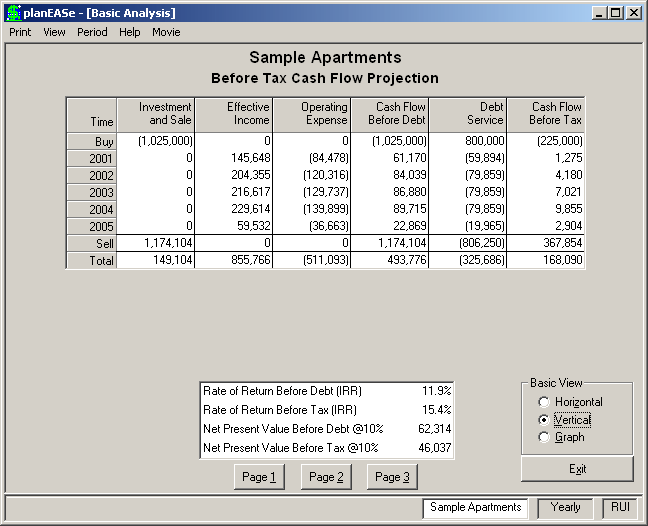
This page shows the cash flows associated with the property and the loan package. The purpose of this page is to analyze the attractiveness of the property as an investment without any consider- ation of the tax implications. The following discussion treats each column of information in order, from left to right.
Investment and Sale shows the capital cash results of the acquisition and sale of the property. At the Buy, the total capital cash outlay is $1,025,000, which consists of $1,000,000 spent for the property, plus $25,000 closing costs, capitalized for tax pur- poses. When the property is sold, the capital receipts are five times the gross income of $200,000 annually inflated for four years at 6%, less the 7% closing costs incurred then. This amounts to $1,174,104. If there were any Capital Expenditures planned during the holding period, those amounts would also be shown in this column as negative amounts (additional investments). The total of the negative amounts in this column then is the Adjusted Basis of the property, and the sale amount represents the Net Sales Price for Capital Gain determination.
Effective Income shows the cash receipts from your Revenue Assumption Pages in each year of operation, with any specified vacancies subtracted. The amounts in 2001 and 2005 are lower than in other years because there are only 9 months of operation in 2001 and three months in 2005 due to the assumed four year holding period.
Operating Expense shows the cash expenses from your Expense Assumption Pages, including any Management Fees specified in Revenue Pages. Thus the $120,316 in 2002 is $100,000 inflated at 8% for 15 months plus 5% of the Effective Income as the property management fee. Any expensed closing costs (there are none here) are shown in the Buy line in this column. Similarly, any expensed selling costs (there are none here) are shown in the Sell line here.
Cash Flow Before Debt is simply the sum of the first three columns. This is the cash flow that would occur if there were no financing. The operating numbers in this column, then, represent what many call the Net Operating Income, and the $493,776 total of this column represents the total profit made over the four year holding period on the property itself. Going across the total line, you can see that this profit is made up of $149,104 in property appreciation, and $855,766 less $511,093 in operating profit.
Debt Service is taken from the Loan Assumptions, and shows the total results of the two loans. A total of $800,000 has been borrowed. The annual payments of $79,859 are made up of 9% of $200,000, or $18,000, plus the payment on a 30 year mortgage of $600,000 at 9.75%, or $61,859. The $806,250 repayment upon sale represents the outstanding principal plus the assumed prepayment penalty on the mortgage. Any loan points are subtracted
from the loan proceeds shown here. For this reason, loan points should not be included in the assumed closing costs.
Cash Flow Before Tax is the sum of the Cash Flow Before Debt and the Debt Service, thus showing the effect of debt leverage in that the required investment is lowered from $1,025,000 to $225,000. This $225,000 represents the down payment on the property and is derived, as you can see by going across the Buy line, by adding the property price ($1,000,000) to the closing costs ($25,000) and subtracting the amount borrowed ($800,000). The $168,090 total of this column represents the profit made over the four year holding period before tax. It is made up of the $493,776 profit on the property itself less $325,686 in interest and other debt charges.
Rate of Return Before Debt (IRR) of 11.9% means that you would earn that rate of return on your $1,025,000 investment if you did not finance the property. Since the IRR is defined as the discount rate where the Net Present Value of the cash flows is zero, you know that, had you entered a Present Value Discount Rate Before Debt of 11.9% in your Assumption Set, the Net Present Value Before Debt would have been (close to) zero.
Rate of Return Before Tax (IRR) is 15.5%. The calculation of this particular IRR is discussed in detail as an example in the Discounted Cash Flow Theory section. Here the investor is borrowing at an effective rate of about 10% to finance a property with a 11.9% rate of return. Thus by this use of leverage the rate of return is increased to 15.5%.
The difference between the before debt and before tax rates of return is an important measure of the risk associated with the investment. If these two rates of return are close to each other, there is a significant possibility that unanticipated changes in revenues, expenses, or sale price could lower the Rate of Return Before Debt below the cost of debt, thus making the investment unattractive. The cost of debt is generally controlled by the marketplace. For this reason, successful investors concentrate on finding properties where the Rate of Return Before Debt is greater than the cost of debt, as is true in this case. A good rule of thumb is that the IRR before debt (11.9% here) should be at least 2 points greater than the cost of debt, which is almost true in this example.
Net Present Value Before Debt is computed using the Present Value Discount Rate Before Debt you enter in the Assumption Set (10% in this case), and represents the Net Present Value of the Cash Flow Before Debt discounted at that rate. If you had entered a zero discount rate, for instance, the Net Present Value Before Debt here would be $493,776. The Net Present Value Before Debt of $62,314 shown here means that you could afford to pay that much more for the property, and still have a 10% rate of return before debt. Viewed another way, it means that if you placed $1,025,000 plus $62,314 in a bank paying 10% interest compounded annually, and withdrew the positive amounts shown in the Cash Flow Before Debt column at the times shown, the bank would have paid you $493,776 in interest over the four year period.
Net Present Value Before Tax of $46,037 is slightly lower than the Net Present Value Before Debt because the effective cost of debt (due to the prepayment penalty) is just above 10%. Since the discount rate for the Net Present Value is 10%, borrowing at a higher rate than 10% lowers the Net Present Value before tax. The interpretation here is that you could afford to pay $46,037 more for this property and still obtain a 10% IRR before tax.