Lease Analysis
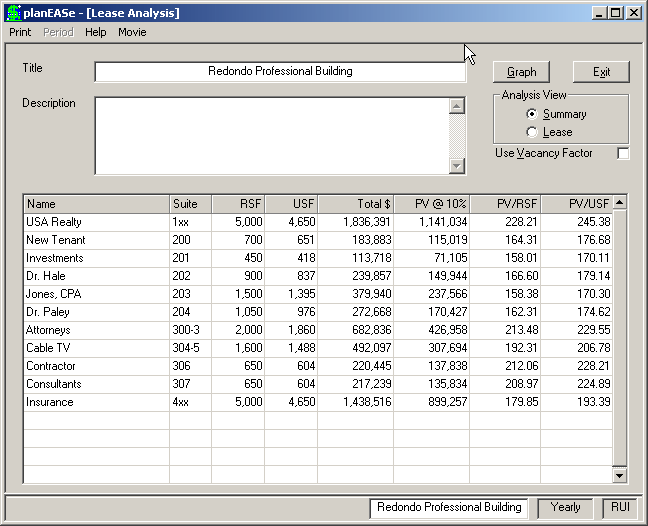
Lease Analysis is automatically produced from the Revenue Pages in your Assumption Set, as shown here (in Summary View) for the Redondo Professional Building. Leases can be sorted in on any column’s values by clicking the column header and choosing ascending or descending order.
Checking the Use Vacancy Factor check box toggles between Gross and Effective values. Suite Number is obtained from the Page Title of the first assumption page of the lease, if it begins with a number (all text through the first space is assumed to be a Suite Number).
You may edit any of the values in the first four columns in the summary view grid (and the description as well), and the edits will be effective while you are in this lease analysis function. Any edits are discarded when you exit Lease Analysis.
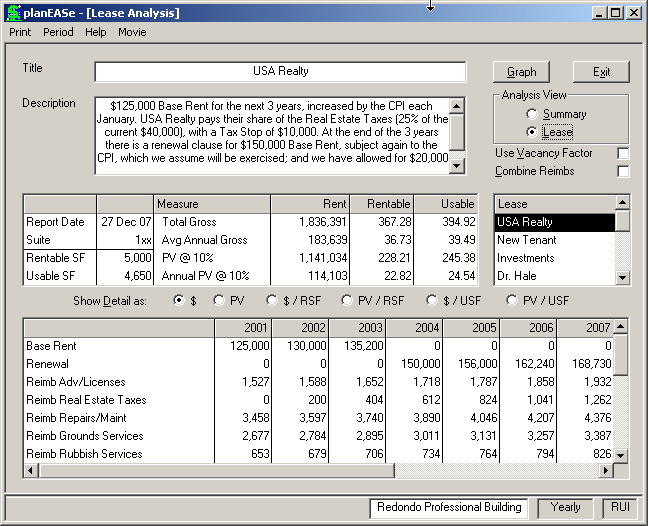
Clicking the Lease option button changes the screen to the Lease View, as shown here. To the right middle of the screen is the Lease List, and clicking on a particular lease (as we have done for the USA Realty lease here) causes the projection for that lease to be displayed. The Page Notes for the first page of the lease are automatically entered in the Description text. While you may change these notes here for printing purposes, any changes will be lost when you return to the Assumption Edit Screen. The text in the Description box prints in the Lease Analysis Report. If your Lease contains reimbursements, they will be shown here (as in this USA Realty lease) and you may combine them into one line by checking the Combine Reimbs checkbox at the middle right of the screen.
Clicking on one of the Show Detail as buttons (in the middle of the screen) changes the detail lines in the lower grid from the $ shown below to PV, $/RSF, PV/RSF, etc. You can print single leases or all the leases at once. If you have purchased the Monthly Extension , the Period Menu Option allows Quarterly and Monthly views of the lease. If you have purchased the Graphics Extension , the Graph button shown on these screens will be present, and you may press it to choose between several available graphs of each View.
The Lease Analysis function may also be used for Tenant Representation and Owner Representation analysis and presentation.
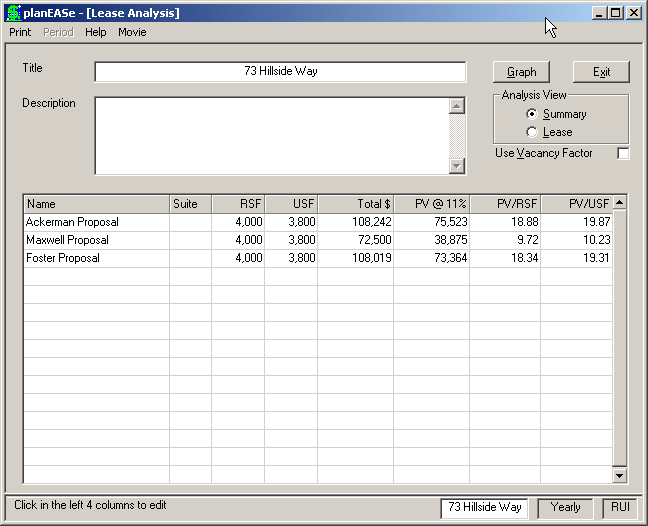
This Summary View of 73 Hillside Way shows the proposals side-by-side for comparison purposes, making it very clear that the Maxwell Proposal is the most attractive from the Tenant perspective.
If you have purchased the Graphics Extension , the Graph button will be present, and you may press it to choose between several available graphs comparing the proposals.
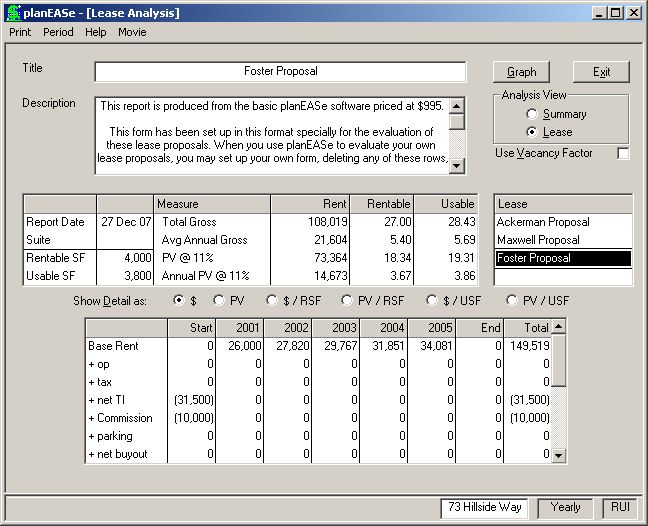
As described on the previous page, clicking the Lease option button changes the screen to the Lease View, as shown here. Note that the Foster Proposal shows a Start and End column for the lease projection. If you specify Tenant or Owner Representation in your Assumption Set (by entering a 1 or 2 in the Price of Property), these columns are shown in Lease View. You may enter starting and stopping values for an item by specifying one-time growth and either 0 for Start or 99 for End in the Revenue Start Date (see the tenant.ru Assumption Set for the 73 Hillside Way example).
Monthly and Quarterly analysis may be produced here if you have purchased the planEASe Monthly Extension . You may switch between Yearly, Quarterly and Monthly analysis (and add/delete yearly totals) using the Period menu on the menu bar while in Lease (not Summary) View. Graphs in Lease View reflect the current Period chosen.
Choose Print/Preferences to set several preferences. The Adjust $/RSF & $/USF for Partial Periods preference (checked by default) adjusts the rate for a 6-month year of $10,000 for 500 SF from $20/sf to $40/sf, allowing easier comparison to the following (full) year.