Annual Statements
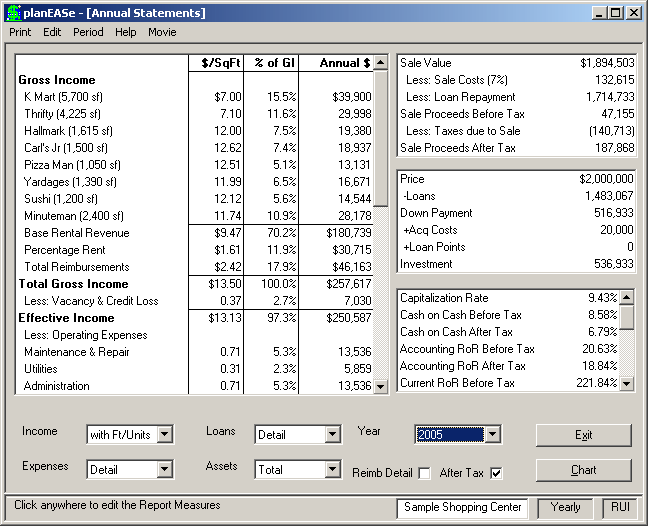
This function allows you to display/print an Annual Statement in Annual Property Operating Data (APOD) report format for your property. The information displayed in the report is exactly the same as the information in the 3 Income Statements (ProForma, Common Size and SqFt/Units) Reports for a particular year. Thus, even though the report looks like an APOD, the amounts are those covering the results of an entire year, rather than the “snapshot at acquisition” represented by the APOD. Here we show the 2005 Annual Statement for the Redondo Professional Building. (on your planEASe System Disk in the Assumption Set named offices.ru).
The Annual Statement Specifications are the controls (checkboxes and listboxes) displayed at the bottom of the screen when you are viewing your Annual Statements. These control settings determine how your Annual Statements are displayed. The settings are largely the same as those for the Income Statements, and the settings are shared with those controls, so, for example, if you set Expenses to Total, they will be shown in total in both Annual and Income Statements. The control settings are saved when you save the Assumption Set, so the default report settings will be in the same configuration when you recall the Assumption Set in future sessions.
Income may be set to with Ft/Units, Total, or w/o Ft/Units. Total summarizes all revenue into one Gross Income figure. with Ft/Units details each revenue and prints the $/SqFt (if Square Footage is positive). If you have used the Calculator to enter SqFt or Units for this Revenue, that SqFt or Unit value is displayed and used. w/o Ft/Units details each revenue and does not print $/SqFt for the revenue even if Square Footage is positive. This is useful for properties where the revenue detail is for individual leases and the Calculator has not been used so dividing the amount by the total footage is nonsense for revenues, but meaningful for expenses. Revenues which are zero throughout the projected period are not shown.
Expenses may be set to Detail or Total. Detail lists each expense individually, with Total Expenses shown at the end. Total simply shows the Total Expenses, with no detail. Expenses which are zero throughout the projected period are not shown. Management Fee is determined the same way as for the APOD. That is, the report generator examines all expense pages for the characters “Management Fee” (caps don’t matter). If it finds one or more, the corresponding expenses (including any following pages whose Page Titles start with an “&”) are added to any Management Fee planned for the property. This allows you to plan management fees either with the Management Fee percentage in the Revenue Pages or as explicit separate expenses, or both.
Loans may be set to Detail, Detail/AT, Total or None. Detail lists each loan individually. Detail/AT adds tax details for each loan, including interest payments and amortized points sections in the tax section, if they apply and are not zero. Total shows only the Total Debt Service with no detail after tax, and None eliminates all Loans from the reports. If you specify None for this option, After Tax is disabled because the tax calculations would be incorrect if the loan information were not included.
Assets may be set to Detail, Detail/AT, Total or None. Detail lists each asset individually. Detail/AT adds tax details for each asset, including depreciation and tax credits sections in the tax section, if they apply and are not zero. Total shows only the Total Capital Spending, Depreciation, and Tax Credits (if any). None eliminates all Assets from the reports. If you specify None for this option, After Tax is disabled because the tax calculations would be incorrect if the assets were not included.
Year (or Month or Quarter with the Monthly Extension ) allows you to choose the year (or quarter or month) you want to display.
Reimb Detail will be shown if Reimbursements are included in the Assumption Set and you have chosen to show Reimbursements Separately (see Preferences on Page 7). In this case, the box is not checked, so Reimbursements are shown in total. If this box is checked, the Reimbursements will be shown expense by expense.
After Tax may be checked, not checked, or disabled. If Loans or Assets are set to None, or the Partnership Models are being used , this is disabled. If checked, the After Tax section of the report is printed. If unchecked, all tax information is suppressed, including, for instance, ratios depending on tax information and after tax measures. Uncheck this switch for Before Tax Analyses. This setting also controls whether the Property Sale Report defaults to After Tax Calculations.
Print/Ratios menu option allows you to specify which of the 16 available ratios will be shown in the Measures Grid. This setting is also used for Income Statements, and is applied to all Income and Annual Statements until you change it. Thus you may eliminate Gross Income Multiple from all such reports forever by unchecking it here.
Print/Measures menu option allows you to specify which of the available measures will be shown in the Measures Grid.
Monthly and Quarterly Statements may be produced if you have purchased the planEASe Monthly Extension . Monthly/Quarterly Statements are in the same format, but do not show Sale Proceeds or Measure grids. You may choose to show Monthly/Quarterly/Yearly Statements using the Period menu on the menu bar.
Graphs If you have purchased the Graphics Extension , a Chart button will be available, offering Pie Charts of the information contained in the report. Pie Charts are available showing Use of Gross Income, Use of Effective Income, Operating Expenses, and Source of Gross Income. Graph data reflects the values for the current period chosen with the Period menu
Printing When you choose to print your Annual Statement, the Print Options Dialog allows you to whether or not to print the Acquisition and Sale Grids at the top of the report, and the Measures Grid at the bottom of the report. The Measures Grid may optionally be printed alone on an added Page 2 of the report. planEASe sizes the print font to fit the available space on the printed page. Thus, widening the margins (top and bottom), printing to legal size paper, or eliminating one or more Measures (like Gross Income Multiple) will increase the font size. Likewise, you can set the Income ListBox to Total, and explain your Revenues with the RentRoll and/or Lease Analysis Reports. Yet another way to increase the font size is to eliminate printing either the top two grids or the Measures Grid, or both.