Basic Analysis
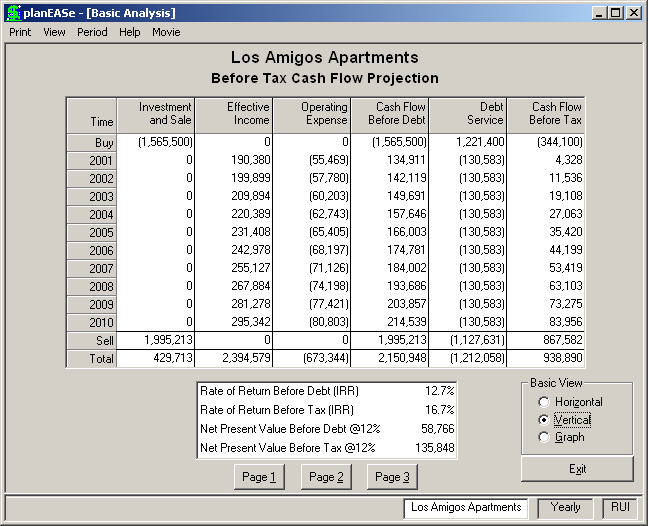
Basic Analysis allows you to view/print the overall cash flow projection for the investment in any of three Views: Vertical, Horizontal, or Graph. To change between these views, just click the appropriate Basic View Button (at the bottom right of the screen). Here you are seeing the Basic Analysis in Vertical View (the Before Tax Cash Flow Projection, Page 1) for the Los Amigos Apartments, an investment on your planEASe System Disk saved under the Assumption Set name apartments.ru. The Basic Analysis Screen contains a View Control at the right bottom of the screen allowing you to switch between the three Views of your analysis.
Vertical View organizes the Cash Flow Projection with the years running vertically down the side of the page and presents the information as separate pages (3 pages for the Real Estate Investment Analysis , models RUI and RUM, and 5 pages for the four Limited Partnership / LLC Models). You may view any of these pages by pressing the corresponding Page Button at the bottom of the screen.
Horizontal View organizes the Cash Flow Projection in a one page spreadsheet format, with the years running horizontally across the top of the page, and each of the 3 (or 5) pages presented as a separate horizontal section of the spreadsheet.
Graph View (available if you have purchased the optional Graphics Extension ) allows you to display/print four different graphs of data contained in your Basic Analysis. Any Debt Funding or Repayment and/or any Capital Spending planned during the Holding Period is eliminated from these graphs so that they reflect the results of ongoing operations rather than such one time events. The Graphs are: Allocation of Effective Income, Cash on Cash, Debt Coverage Ratio, and Net Capitalization Rate.
Monthly and Quarterly Analysis may be produced here instantly if you have purchased the planEASe Monthly Extension . You may switch between Yearly, Quarterly and Monthly Analysis (and add/delete yearly totals) using the Period menu on the menu bar. In Basic and Detail Analysis, the Period menu is also available in Graph View, so you may switch between period views there as well.